Just like the All Ordinaries Index which measures the daily performance of equities, the Australian iTraxx uses credit default swap (CDS) indices to measure investors’ perception on risk in the bond market. CDS, sold in minimum $10m parcels, allows professional investors to buy or sell protection against the risk of default of a set of the most liquid bonds in the market. The iTraxx indices were developed in order to bring greater liquidity, transparency and acceptance to the credit default swap market. Movements in the iTraxx are a good indicator of the general direction of the bond market.
The Australian iTraxx is a ‘proxy’ for credit spreads in Australia and is part of a larger group of indices, namely the iTraxx Asia, Europe and the Dow Jones CDS indices in North America and Emerging Markets. iTraxx Asia is comprised of the iTraxx Japan, iTraxx Asia ex-Japan and iTraxx Australia. iTraxx Australia (Aussie iTraxx) is the smallest of the three.
The Aussie iTraxx comprises 25 entities which have a set of requirements in terms of membership determination:
- The entity has to be listed on the Australian Stock Exchange (ASX) and have a five year CDS
- All entities must be investment grade as rated by three major rating agencies (S&P, Moody’s and Fitch). This translates to Baa3 by Moody’s, BBB- by S&P and Fitch
- Market makers submit a list of the most liquid traded entities for the previous 12 months to the International Index Company (IIC). IIC then computes final liquidity ranking for each entity. The entities making the iTraxx are the top 25 as per the IIC final list
- All constituents have equal weighting of no more than 4%
- No more than 5 banks can be included in the Index, thus comprising no more than 20% of the total weighting
The price of the iTraxx is simply the weighted average basis point (bps) cost on the constituent CDS contracts, thus the price of the iTraxx changes along the bps change of the underlying contracts over time.
iTraxx does not incorporate outright yields, namely the movement in base interest rates such as the Government bond risk free rate, the RBA cash rate or the bank bill swap rate (BBSW). The Index only considers the credit spread component that is layered over the base interest rate or yield curve.
The Index is rolled every six months – in March and September. Currently the iTraxx is in series 17 and will roll into series 18 on the 20 September 2012. Composition of the Index is typically stable over time. Over the past 16 series, 11 CDS names moved out of the Index with some entities (e.g. Alinta, Coles, PBL, Rinker etc) being taken over and ceasing to exist on a standalone basis. The new 18 series will see AMP Group Holdings move out, while the Telenz Telecom Corporation of New Zealand Limited is moving in. As mentioned before, the 25 entities are the most liquid in the Asia-Pacific region, and while the Aussie iTraxx remains the smallest in the group, there have been calls to widen the number of companies covered by allowing more names in the Index.
Table 1 below depicts the current composition (17 series) and corresponding individual CDS values, and compares with the values at the Index’s peak in 2012.

Table 1
From the table above we note:
- The biggest mover since start of June was Foster’s Group, a global beverage company, with its CDS contracting by 55%, therefore being perceived as very low risk by the investors
- The lowest was Qantas, an Australian airline carrier. Its CDS contracted by only 4% since June 2012. It is worth noting that widest point for Qantas CDS was on 27 June 2012 at 433bps, as over the past year investors requested more protection for the perceived risk of the struggling airline. However, the past two weeks saw a sharp decline of 47bps (down 12% compared to 401bps on 3 September) as Qantas announced its deal with Emirates and investors perceive that the alliance will help support the business.
- Finally, the ‘big four’ banks included in the Index contracted equally and currently trade at similar level. Not surprisingly Macquarie Bank is perceived as more risky by investors. Many corporate names included in the index are trading tighter than banks/ financial companies, indicating that investors have more confidence in the risk of these companies compared to financial institutions.
As mentioned before, the iTraxx is a gauge for assessing movement and trends in CDS markets. The iTraxx is also used within fixed income portfolios to protect against losses on default associated with the failures of the corporate issuers. Naturally, the effectiveness of the protection depends on how well the iTraxx replicates the characteristics of the investor’s physical credit exposure. In addition, it is useful for investors seeking further diversification within their fixed income portfolios. As an additional bonus, it is very liquid, always provides reliable pricing and is very easy to exit from.
What does the iTraxx tells us?
When we talk about the iTraxx, the two most common phrases used to describe its movement are “tightened” or “widened”. The Australian iTraxx provides a snapshot of market sentiment, thus the higher the value of the iTraxx (or when the Index is “widening”), the higher the perceived risk, therefore investors require a higher compensation, in the form of credit spread, for taking that extra risk.
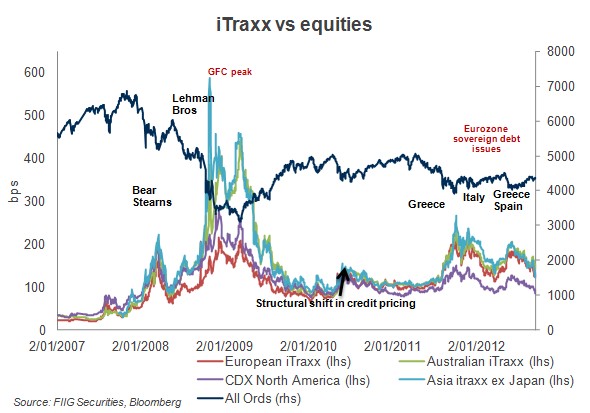
Figure 1 below charts the iTraxx from 2008 to current and points out some credit event triggers for the movements in the Index. It also compares the Australian Index with its European, American and Asian counterparts and domestic equity market. Figure 1 below shows that during the peak of the GFC, the Aussie iTraxx was trading much closer to the Asian iTraxx due to high concerns over global growth (China being the main driver of the overall growth).

Figure 1
Prior to the GFC, there was close to no volatility in the Australian Index, which was trading at around the 30bps mark. The tides changed in 2008, at the onset of the GFC; and while there was some consolidation throughout 2010 - early 2011, the Index has been behaving more erratically, reacting to any slight changes in investor sentiment.
At the peak of the GFC, when the risk of the banking system collapse was very real and equity markets were hit hard, the Aussie iTraxx traded as wide as 445bps, almost 15 times higher than its pre-crisis levels. Four years on, and credit spreads remain elevated but roughly 69% lower than the peak. On 14 September the Index was trading at 136bps, tightening on the QE3 news coming from the US. It is now 70bps lower, compared to the 4 June 2012 high of 206bps.
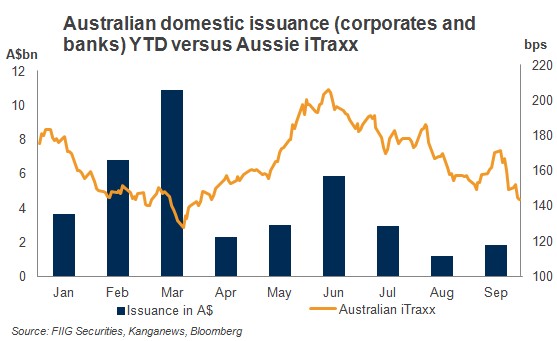
The contraction in credit spreads (meaning it was cheaper for companies to borrow) in the 1Q12 sparked a rush of bond issuance, as evidenced from Figure 2 below and if the iTraxx continues to trend tighter, it is expected that there will be a rush of corporate issuance in the 3Q12.

Figure 2
Clearly, the iTraxx has been more volatile and is trading wider than pre-GFC levels. But, this does not mean the companies in the Index are higher risk. Rather, the iTraxx is also a hedging tool and showed more volatility due to Eurozone woes and contraction of the Chinese economy, rather than reflecting a lower credit quality of the underlying entities.