by
Dr Stephen J Nash | Sep 05, 2012
In stressed markets, investors seek low risk assets, yet cash doesn’t have the protective qualities that bonds offer. That is fixed rate bond outperform when equity markets decline.
By seeking cash and not bonds investors are effectively giving away potential risk adjusted return. This article looks at how cash and bonds perform in different equity market conditions (1) After considering different types of equity markets, the performance of bonds, relative to cash, is made in a portfolio sense. Once again, bonds come up with the goods; adding more return than risk to portfolios, and extra return above risk comes in very handy when the outlook for growth is not that strong.
Cash underperforms
While cash increases certainty, it lacks a crucial component; interest rate risk. When the equity market is weak, market participants are questioning the ability of equities to deliver on historical returns, while fixed rate bonds do not allow that flexibility to the issuer. Fixed rate bonds pay a defined interest payment that does not change over the life of the bond, so the only way these bonds can reflect a change in market sentiment is through a change in price and when the market expects lower returns, fixed rate bond prices rise. It is at this time that we’d expect equity prices to fall. Hence, the market tends to value a fixed cashflow, as presented by the fixed rate bond, more highly as the following sequence of events typically occurs:
- Fears of growth impact on growth expectations, pushing equity prices lower
- Fears of growth impact the perceptions of the RBA, who seek to boost growth to trend levels by increasing the cash rate, so as to ensure stable employment outcomes while also ensuring low inflation
- Low RBA rates reduce the funding level on government bonds and all bonds are typically referenced to these bonds. As the funding level falls, then government rates tend to fall, all else being equal, which leads to higher bond prices
These results are summarised in the below table, where the return of bonds to cash is compared in different equity market states. In particular, the following states are considered where:
- Annual equity return is lower than average
- Annual equity return is lower than the average, less one standard deviation
- Annual equity return is above average
- Annual equity return is above average plus one standard deviation
Results are shown in Table 1 below.
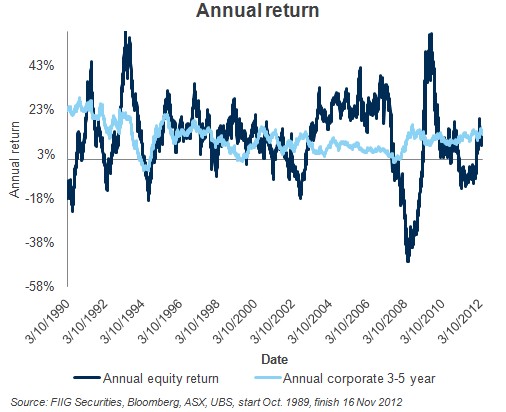
Table 1
Asset class data is as follows:
- Equities: All ordinaries accumulation, 3 October 1989 to 24 August 2012, daily
- Fixed rate bonds: UBS Composite 0+yrs, 3 October 1989 to 24 August 2012, daily
- Cash: UBS Bank Bill, 3 October 1989 to 24 August 2012, daily
Notice that bonds, over the total data set beat cash by over 40%. However, more interestingly, bonds do better the worse the equity market does, as shown in Figure 1 below.
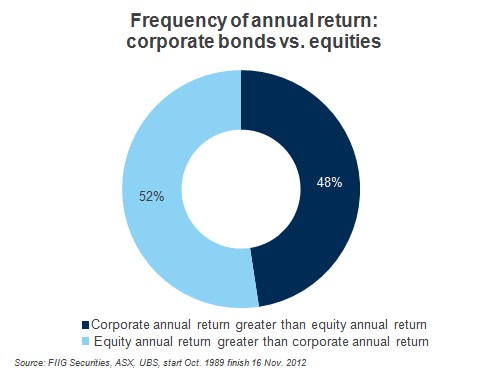
Figure 1
Cash and bonds in a portfolio
If bonds beat cash, and beat cash more when equities have below average annual returns, then you might expect that bonds should do the following two things to a portfolio:
- Bonds should add more return, relative to a cash allocation
- Bonds should not increase risk significantly more than return, relative to a cash allocation
It is possible to test this expectation by looking at the following two allocations to cash, bonds, and equities:
- 75% bonds and 25% equities, or the “bond allocation”, and
- 75% cash and 25% equities, or the “cash allocation”.
In many ways, the following time series tells the story, as shown in Figure 2 below.
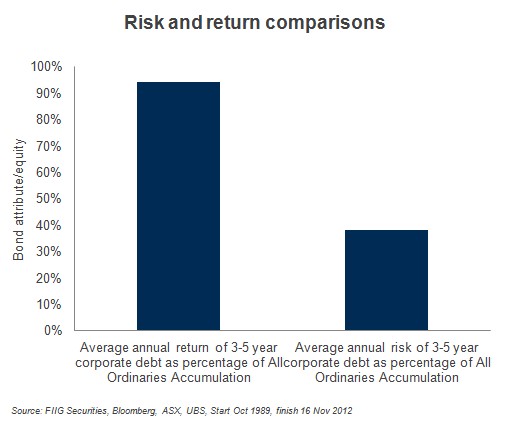
Figure 2
Notice how the bond return tends to be higher, and volatility, or risk, varies yet is lower, especially during the global financial crisis period than the higher weighted cash portfolio allocation. We can then look at the frequency of times that the bond allocation beats the cash allocation, as shown in Figure 3 below.
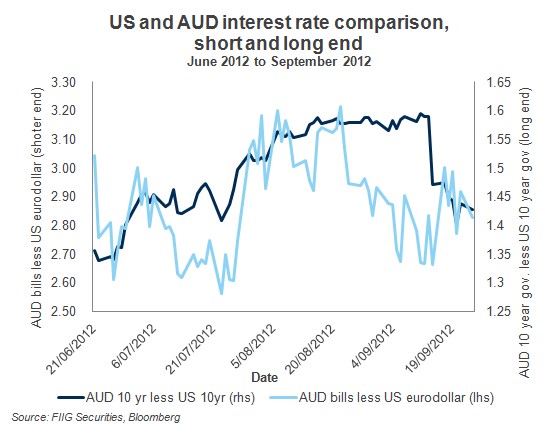
Figure 3
Figure 4 shows that a higher bond allocation has higher annual returns than a higher cash allocation 69% of the time over the period 1989 to 2012.
Finally, and most importantly, we need to consider risk, or the degree to which returns can be expected, most of the time, to vary around the average. As Figure 4 shows, the bond allocation adds much more return, compared to risk. Specifically, the bond allocation gives an average return increase of around 1.99%, for a lower increase of risk, of around 1.75%.
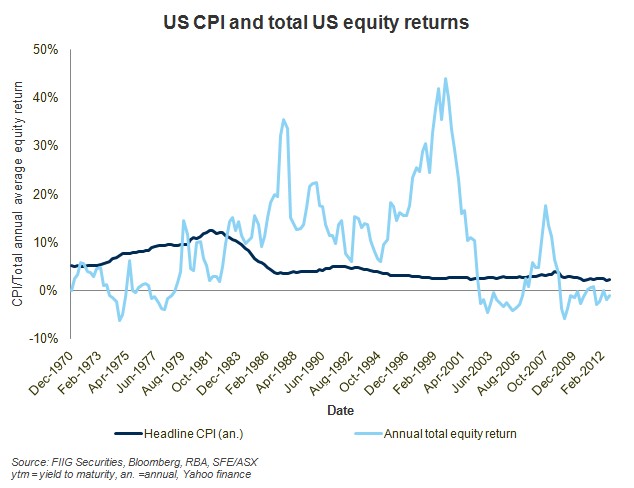
Figure 4
Conclusion
The rush to cash is now endemic in most SMSF allocations, and we can understand the need to reduce portfolio risk. However, we cannot understand how some SMSFs continue to ignore an asset class that provides more return than risk, in a low return environment. This article shows that bonds beat cash in all types of markets, because they have extra risk; more risk gives more return. However, the interest rate risk in bonds works very well for investors when times are bad for equities, and we all know that we have seen those times of late. Whether equities do well, or not, bonds add more annual return to a portfolio than annual risk. On average, the bond allocation suggested herein can add 2% return to your portfolio, relative to the cash allocation. An extra 2% comes in very handy, year after year, especially in a low return environment.
(1) Asset class returns are estimated using the following data:
Equities: All ordinaries accumulation, 3 October 1989 to 24 August 2012, daily
Fixed rate bonds: UBS Composite 0+yrs, 3 October 1989 to 24 August 2012, daily
Cash: UBS Bank Bill, 3 October 1989 to 24 August 2012, daily