by
Dr. Stephen Nash | Mar 27, 2013
While equity returns provide access to growth in the underlying economy, they do not insure investors against variations in inflation. This brief study shows that long term data supports the premise that inflation and equity returns remain largely unrelated, and that one needs to ensure that the portfolio has adequate insurance against inflation. It seems likely that when investors recognize the value of inflation linked bonds (ILBs), as a form of portfolio insurance against inflation, it seems inevitable that current yields above inflation will fall; and fall substantially.
Equity return compared to inflation
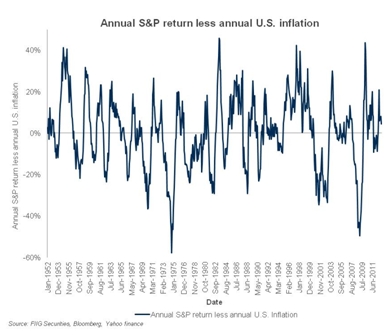
Generally, equity returns do not have any definitive relationship to inflation. As Figure 1 shows, annual equity return, as measured by the S&P 500, varies around the annual inflation rate substantially, over a very long period.

One can try to more effective measure how equities might provide protection against inflation by looking at correlation analysis, especially the correlation between annual U.S. inflation and annual S&P returns. Correlation between two time series can be calculated with reference to a correlation coefficient. Correlation typically has a range between -1, which is a perfect negative correlation, and +1, which is a perfect positive correlation. Perfect negative correlation implies that the two time series move in opposite directions, whereas perfect correlation implies that both time series move together; either up or down in the same direction at the same time. If the correlation is 0, the movements of the securities are said to have no correlation.
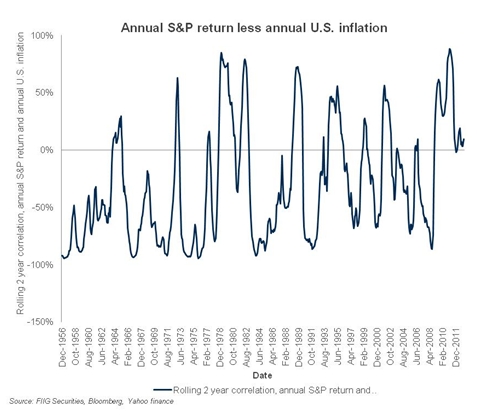
As Figure 2 shows, correlation between annual equity return and annual inflation, in the U.S., varies substantially, and is generally more negatively correlated than positively correlated. However, the general conclusion is that there is no significant relationship between inflation and equity returns using this long term U.S. data. Such a conclusion is supported by other commentators, as the following quote indicates,
To sum up - if there is any relationship to reveal at all, it appears that inflation and equity returns are actually marginally negatively correlated. This should not be particularly surprising given the poor performance of equity markets during the inflationary 1970's, and subsequent strong performance since inflation has trended lower (Hamilton J., Jones, B., Suvanam, G., Challa, A., (2007), Australian LDI; Liability Driven Investment Has Arrived: Part 1, Deutsche Bank, 18 May 2007, pp.4-5).

Figure 2
As Figure 2 shows, the correlation has been negative for most of the period in question, which means that most of the time, the two times series tend to move in the opposite direction. Equities are driven by very different things other than inflation, especially expectations of growth, which remain notoriously volatile. Expectations dominate equity pricing as the earnings of companies remain difficult, or impossible, to effectively predict in perpetuity. Since equities provide perpetual access to the earnings of a company, the pricing of equities reflects variations in expectations of earnings over a very long period. This is why equities vary so much in price - as expectations move from optimistic to pessimistic, and from pessimistic to optimistic.
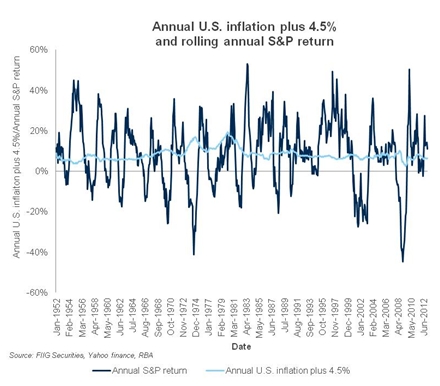
Given the significant volatility of equity returns, due to these serious and unavoidable difficulties in forecasting, one would expect that one would be rewarded in excess of inflation for assuming this risk. Such an expectation is generally correct, in that equities beat inflation by about 4.5% over the period. More specifically, whereas equities return around 8.31% on an average annualised basis, since 1950 in this study, that return is around 4.64% over inflation. Hence, equities, over the longer term, deliver in the region of 4 to 5 percent above inflation.

Figure 3
As Figure 3 shows, a rolling 4.5% return, above inflation, as shown by the light blue line, is roughly equivalent to all the volatility in equity returns, as shown by the dark blue line when one summarises the data for over 70 years. In other words, investment grade ILBs with real returns around 4%, can provide a similar return to equities, yet in a much more stable format, and with a much more senior position in the capital structure; senior secured in most cases, which is the highest point of the capital structure, as opposed to equity which sits at the bottom of the capital strucutre. Accordingly, ILBs provide an effective refuge from the raging storm of volatility that is provided by equity return, while also protecting investors against the risks of unexpected inflation. Instead of weathering the cycle of equity boom and bust, using ILBs seems to be a much more effective way of achieving return targets above inflation, while much more effectively protecting against unexpected inflationary surges and falls.
Conclusion
As we indicated last week, inflation needs to be taken seriously in the construction of portfolios, and this brief study shows that ILBs can provide an equivalent return to equities relative to inflation, without all the volatility which equity investors encounter. One might wonder why one would assume all the risk of equity investing, especially the risk that inflation erodes the value of saving, when ILBs provide such an effective alternative. Risks to inflation still remain very important to consider, as was indicated last week, and ILBs have a crucial, and hitherto largely unrecognized, role to play in terms of insuring the portfolio against inflation.
As investors become aware of the value of this inflation insurance through ILBs, the current yield above inflation, of around 4%, is likely to fall, as demand inevitably exceeds the supply of ILBs. In other words, the underlying value that currently exists in ILBs will lead to higher and higher prices, and those who move first, and purchase these securities, will benefit most.
List of References
- Ahmed S. and Cardinale M., 2005,‘Does inflation matter for equity returns?', Journal of Asset Management, 6, 259-73.
- Ang, A. Wei, M. and Bekaert, G., 2008, The Term Structure of Real Rates and Expected Inflation, 63(2) Journal of Finance, 797-849.
- Australian Bureau of Statistics, 2011, Information Paper: Introduction of the 16th Series Australian Consumer Price Index, Australia, September (cat. no. 6470.0).
- Australian Bureau of Statistics, 2005, Information Paper: The Introduction of Hedonic Price Indices for personal Computers, (cat. 6458.0).
- Alquist R and L Kilian (forthcoming), ‘What Do We Learn from the Price of Crude Oil Futures?’, Journal of Applied Econometrics.
- Balke NS, SPA Brown and MK Yücel (2009), ‘Oil Price Shocks and U.S. Economic Activity: An International Perspective’, mimeo, Federal Reserve Bank of Dallas.
- Barsky RB and L Kilian (2002), ‘Do We Really Know that Oil Caused the Great Stagflation? A Monetary Alternative’, in BS Bernanke and KS Rogoff (eds), NBER Macroeconomics Annual 2001, 16, MIT Press, Cambridge, pp 137–183.
- Barsky RB and L Kilian (2004), ‘Oil and the Macroeconomy since the 1970s’, Journal of Economic Perspectives, 18(4), pp 115–134.
- Bernanke BS, M Gertler and M Watson (1997), ‘Systematic Monetary Policy and the Effects of Oil Price Shocks’, Brookings Papers on Economic Activity, 1, pp 91–142.
- Blanchard OJ and J Galí (2010), ‘The Macroeconomic Effects of Oil Price Shocks: Why Are the 2000s So Different from the 1970s?’, in J Galí and M Gertler (eds), International Dimensions of Monetary Policy, University of Chicago Press, Chicago, pp 373–421.
- Bodenstein M, Erceg CJ and L Guerrieri (2007), ‘Oil Shocks and External Adjustment’, Board of Governors of the Federal Reserve System International Finance Discussion Paper No 897.
- Bohi DR (1989), Energy Price Shocks and Macroeconomic Performance, Resources for the Future, Washington DC.
- Bruno M and J Sachs (1982), ‘Input Price Shocks and the Slowdown in Economic Growth: The Case of U.K. Manufacturing’, Review of Economic Studies, 49(5), pp 679–705.
- den Haan WJ (2000), ‘The Comovement between Output and Prices’, Journal of Monetary Economics, 46(1), pp 3–30.
- den Haan WJ and SW Sumner (2004), ‘The Comovement between Real Activity and Prices in the G7’, European Economic Review, 48(6), pp 1333–1347.
- Dvir E and KS Rogoff (2009), ‘The Three Epochs of Oil’, Boston College Working Paper in Economics No 706.
- Edelstein P and L Kilian (2007), ‘The Response of Business Fixed Investment to Changes in Energy Prices: A Test of Some Hypotheses about the Transmission of Energy Price Shocks’, B.E. Journal of Macroeconomics, 7(1) (Contributions), Article 35.
- Edelstein P and L Kilian (2009), ‘How Sensitive Are Consumer Expenditures to Retail Energy Prices?’, Journal of Monetary Economics, 56(6), pp 766–779.
- Hamilton JD (2009), ‘Causes and Consequences of the Oil Shock of 2007–08’, Brookings Papers on Economic Activity, 1, pp 215–261.
- Hamilton J., Jones, B., Suvanam, G., Challa, A., (2007), Australian LDI; Liability Driven Investment Has Arrived: Part 1, Deutsche Bank, 18 May 2007, pp.4-5
- Kilian L (2008a), ‘A Comparison of the Effects of Exogenous Oil Supply Shocks on Output and Inflation in the G7 Countries’, Journal of the European Economic Association, 6(1), pp 78–121.
- Kilian L (2008b), ‘The Economic Effects of Energy Price Shocks’, Journal of Economic Literature, 46(4), pp 871–909. 84 Lutz Kilian
- Kilian L (2008c), ‘Exogenous Oil Supply Shocks: How Big Are They and How Much Do They Matter for the U.S. Economy?’, Review of Economics and Statistics, 90(2), pp 216–240.
- Kilian L (2009a), ‘Comment on “Causes and Consequences of the Oil Shock of 2007–08” by JD Hamilton’, Brookings Papers on Economic Activity, 1, pp 267–278.
- Kilian L (2009b), ‘Not All Oil Price Shocks Are Alike: Disentangling Demand and Supply Shocks in the Crude Oil Market’, American Economic Review, 99(3), pp 1053–1069.
- Kilian L (2010), ‘Explaining Fluctuations in Gasoline Prices: A Joint Model of the Global Crude Oil Market and the U.S. Retail Gasoline Market’, Energy Journal, 31(2), pp 103–128.
- Kilian L and B Hicks (2009), ‘Did Unexpectedly Strong Economic Growth Cause the Oil Price Shock of 2003–2008?’, CEPR Discussion Paper No 7265.
- Kilian L and LT Lewis (2009), ‘Does the Fed Respond to Oil Price Shocks?’, mimeo, Department of Economics, University of Michigan.
- Kilian L and C Park (2009), ‘The Impact of Oil Price Shocks on the U.S. Stock Market’, International Economic Review, 50(4), pp 1267–1287.
- Kilian L, A Rebucci and N Spatafora (2009), ‘Oil Shocks and External Balances’, Journal of International Economics, 77(2), pp 181–194.
- Kilian L and C Vega (2008), ‘Do Energy Prices Respond to U.S. Macroeconomic News? A Test of the Hypothesis of Predetermined Energy Prices’, CEPR Discussion Paper No 7015.
- Kilian, L (2009), ‘Oil Price Shocks, Monetary Policy and Stagflation’, Conference paper, Inflation in an Era of Relative Price Shocks 17–18 August 2009, jointly hosted by the Reserve Bank of Australia and the Centre for Applied Macroeconomic Analysis.
- Kilian L and RJ Vigfusson (2009), ‘Pitfalls in Estimating Asymmetric Effects of Energy Price Shocks’, Board of Governors of the Federal Reserve System International Finance Discussion Paper No 970.
- Nakov A and A Pescatori (2010), ‘Monetary Policy Trade-Offs with a Dominant Oil Producer’, Journal of Money, Credit and Banking, 42(1), pp 1–32.
- Rotemberg JJ and M Woodford (1996), ‘Imperfect Competition and the Effects of Energy Price Increases on Economic Activity’, Journal of Money, Credit and Banking, 28(4), pp 549–577.