by
the Research team | Jul 15, 2014
Key points
The start of July is a good time to provide a market summary for the end of the last financial year.
- Demand for Australian public sector debt has remained high in FY2013-14, rising to A$61.23bn from A$56.45bn the previous year. This was due to Australia's solid economic performance and the high credit ratings in the public sector.
- Australian corporations have continued to have good access to bond markets both domestically and offshore, raising a total of A$43.46bn in debt domestically.
- Australian financial institutions and corporations remained active in offshore markets in the last 12 months with US dollar issuance of A$87.21bn through both public and private placements. However, Euro and GBP issuance was well below USD issuance at A$27.88bn and A$9.14bn respectively.
- Significant contraction in credit spreads (meaning it was cheaper for companies to borrow) in the second half of FY2013-14 sparked a rush of bond issuance.
- The yield on 10 year Australian Government bonds trended down over the last financial year.
- There was an increase in activity in the Australian dollar BBB-rated non-financial corporate bond sector, with approximately A$4.5bn of new issuance in the year to 30 June 2014, almost double the volume issued in the prior financial year.
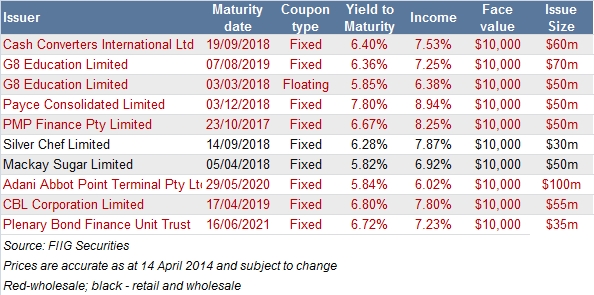
- The year also saw the continued development of the A$ high yield bond market, with FIIG leading the charge with 10 new unrated issues for a total issue value of $A550m.
- Foreign investor demand for Australian Residential Mortgage Backed Securities (RMBS) has been quite high, reflecting the lack of supply of RMBS in foreign markets, the global search for yield, and confidence in the high quality of the underlying collateral of Australian RMBS.
1. Government issuance
Demand for Australian public sector debt has remained high in FY2013-14 due to Australia's solid economic performance and high credit ratings of public sector issuers. According to the Reserve Bank of Australia, the Federal government is currently one of only 13 AAA-rated (by Standard & Poor’s rating agency) sovereigns globally, attracting continuing demand for Commonwealth government securities, particularly from official reserve managers.
According to Bloomberg data, a total of A$61.23bn in debt was issued domestically in FY2013-14 by Australian government and semi-government issuers compared to A$56.45bn in FY2012-13. There weren’t any bonds issued in July 2013, August 2013 or January 2014, while March 2014 contributed the most to the volumes with A$12.75bn in issuance. This was closely followed by November 2013 with A$11.56bn. According to the Reserve Bank of Australia, conditions faced by Australian bond issuers have continued to improve throughout FY2013-14 reflecting the markedly better conditions in global financial markets as the global economic recovery has become more entrenched and as European sovereign debt concerns eased.
The Reserve Bank of Australia reported that there has been a significant increase in Floating Rate Note (FRN) issuance by state borrowing authorities in recent years, a trend which continued in FY2013-14. The increased FRN issuance has been designed to meet the demand for such paper from banks who want to hold state government paper to meet the soon to be implemented Basel III prudential liquidity requirements. Banks have a natural preference to hold FRNs to match the floating rate nature of their liabilities.
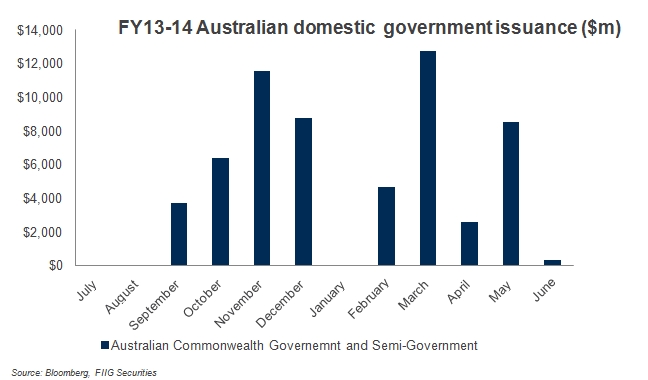
Figure 1
2. New corporate domestic AUD issuance
Australian corporations have continued to have good access to bond markets both domestically and offshore, raising a total of A$43.46bn in debt domestically in the past 12 months compared to A$41.28bn in the second half FY2013-14. The lowest volume was recorded in January 2014 (A$0.81bn) while November 2013 contributed the most to the second half of FY2013-2014 volumes with A$7.18bn issuance. According to the Reserve Bank of Australia, private sector credit grew by 4.7% in the 12 months through May 2014, which was the fastest annual pace since March 2009. Australian corporate issuers (excluding those in the financial sector) sold mostly bonds with maturities of seven years while the US dollar and Euro markets provided scope for longer dated debt in FY2013-14.
The main development in the corporate bond market over the past year or so has been the significant pick up in lower rated issuance into the domestic market and at longer maturities than had been previously achieved domestically. Issuance in the domestic market of lower-rated corporate bonds, which in the case of Australia means those rated BBB+ to BBB−, was the strongest on record and at longer than usual maturities. According to the RBA, investors became more comfortable with moving up the maturity spectrum and down the ratings spectrum in the domestic market in order to pick up yield and corporations are finding the pricing more attractive. The lengthening in maturities reflects two developments: improvement in overall risk sentiment; and the search for yield in a low interest rate environment pushing investors out along the yield curve where yields are higher.
3. Financial institution and corporate foreign currency issuance
Australian financial institutions and corporations remained active in offshore markets in the last 12 months. The second half of the FY2013-14 was the strongest since 1999. The Big Four banks were tapping overseas markets as credit growth in Australia accelerated to the fastest rate in the last five years, buoyed by central banks keeping interest rates at record lows. The cost of shifting funds from US dollars and Euros into the Australian dollar fell in FY2013-14, while credit spreads in the US and Europe tightened.
As the US continued to offer cheap funding opportunities, significant issuance of A$87.21bn equivalent in public and private placement deals was achieved. Of these, 288 deals in the first half of FY2013-14 comprised 62 per cent of the annual total. CBA was the leading offshore borrower of US dollar denominated bonds from June 2013 to June 2014 and raised US$13.88bn of debt, which was closely followed by Westpac with US$10.29bn.
However, Euro and GBP issuances were well below USD issuances at A$27.88bn (in 67 deals) and A$9.14bn respectively in the FY2013-2014. The biggest issuers of Euro denominated bonds were: NAB with A$5.39bn, CBA with A$3.57bn, Westpac with A$3.46bn, and ANZ with A$2.54bn. Sydney Airport was the largest non-financial borrower in 1H14, issuing A$1.04bn of ten year notes in April 2014 along with Brambles, the world’s largest supplier of wooden pallets, which raised A$718m in 10 year bonds in June 2014.

4. iTraxx
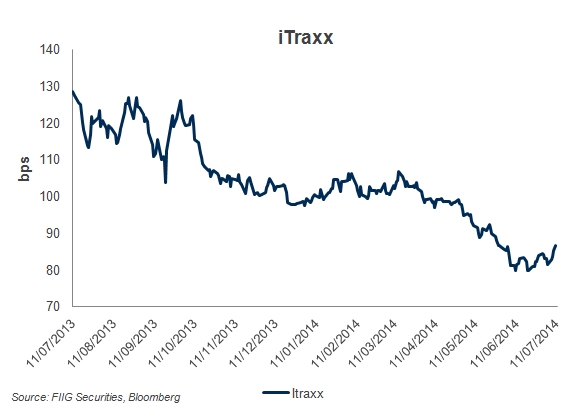
Investors usually use the iTraxx as an indicator of an average spread or margin for a five year credit default swap over and above the benchmark bank bill swap rate (BBSW). It’s essentially a “proxy” of the perception of risk in the market. Movements in the iTraxx are a good indicator of the general direction of the bond market. The iTraxx began FY2013-14 at 128.35bps, dipped below 98.20bps in December, then hit two highs in February and March at 106.15 and 106.68 when perceptions of risk increased. Since then the iTraxx has moved lower and recently settled around 85bps.
The contraction in credit spreads (meaning it was cheaper for companies to borrow) in the second half of FY2013-2014 sparked a rush of bond issuance as evidenced from Figure 1 above, and if the iTraxx continues to trend lower, it is expected that there will be a rush of corporate issuance in the first half FY2013-14.
5. Government bond yield movements
The overall 10 year Australian government bond yield trend was downward sloping in FY2013-14 with greater volatility in the five year yield curve. Ten year yields started the year at 3.7% in July 2013, rose to 4.32% in December 2013 and continued to decrease to 3.4% in June 2014 (see Figure 2).
The RBA said borrowing costs for Australian corporates and state governments were at very low levels historically, while wholesale funding costs for banks, which are more a function of bond spreads rather than bond yield levels, have declined further. Credit spreads are likely to remain higher than their pre-crisis levels, reflecting the repricing of credit and liquidity risk, while yields are likely to remain low for some time as central banks only gradually normalise their monetary policy settings (see Figure 1).
Australia’s central bank benchmark rate is at 2.5%, while those in Europe and the US are near zero. According to Bloomberg data, Australian ten year bonds yielded 3.55% compared with 2.53% for equivalent US securities and 1.25% for similar German bonds.

Figure 1
6. Increased Issuance in the ‘BBB’ Range
The last financial year saw an increase in activity in the A$ BBB non-financial corporate bond sector, with approximately A$4.5bn of new issuance raised in the year to 30 June 2014, almost double the volume issued in the prior financial year.
The table below sets out each of the issues which occurred during FY2013-14:
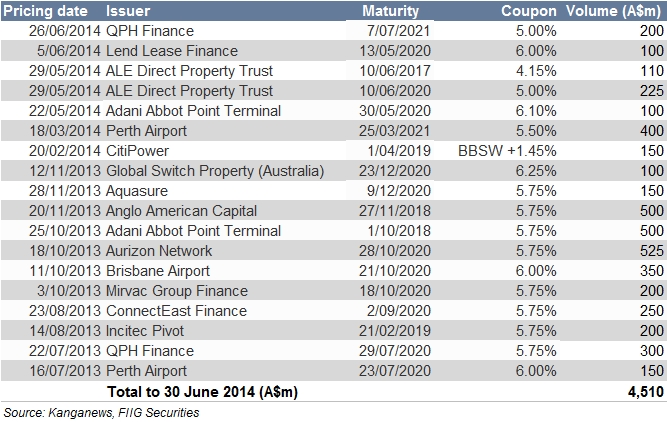
This rapid increase in BBB issuance via the A$ debt capital markets represents a steep change from the state of the domestic BBB market just three years ago. For example, in 2011 there were only six BBB issuances for a total of A$700m. At that time, when Australian BBB credits needed to borrow they could often find more attractive options than the domestic bond market, such as bank loans.
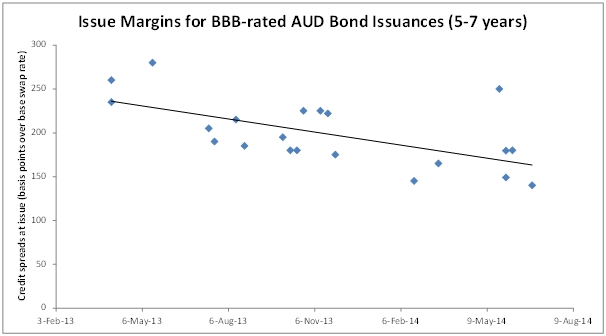
The increase in bond issuances for A$ BBB credits in FY2013-14 can be largely attributed to the favourable conditions being experienced currently in credit markets. The last 12-15 months have seen a significant tightening in credit spreads for new BBB-rated corporate bond issues in the A$ corporate bond market. Since early 2013, when issue spreads for BBB A$ credit were pricing at around the 250 basis points mark, we have seen spreads on BBB credit tighten by about 100 basis points, broadly suggesting that BBB-rated issuers can raise debt in the A$ corporate market today at levels of about 1% per annum lower than they could a year ago by virtue of the reduction in credit spreads (not taking account movements in the underlying base rates).
The chart below highlights the improving trend in BBB issue credit spreads over the last 12-15 months.
Kanganews, FIIG Securities
With spreads at record tight levels and yields close to historic lows, we should expect to see the continued strong volumes of BBB-rated issuances in the A$ corporate bond market.
7. Continued Development of A$ High Yield Market
The last financial year saw the continued development of the A$ high yield bond market, with FIIG originating 10 new unrated issues totalling $A550m. A summary of FIIG’s high-yield issues in 2013/14 is outlined in the table below:
NAB also arranged its first unrated A$ corporate bond issuance in June, raising a 5-year, A$60m bond for NextDC, an ASX-listed independent data centre operator. In terms of rated issuance, Qantas was able to issue the first sub-investment grade bonds into the domestic market, raising A$300m of 8-year paper in May and A$400m of 7-year paper in June. The bonds pay coupons of 7.75% and 7.50% per annum respectively. The original A$300m deal was upsized from an initial A$100m, reflecting the continued quality of the Qantas name in funding markets despite its downgrade to sub investment grade.
In an environment of continued buoyant credit markets and low base interest rates, we should expect to see increased activity in the A$ high yield space. However, further rated high yield opportunities which are targeted at institutional investors are more likely to be name-driven.
8. Resurgence of RMBS
The continual improvement in broad market sentiment has also been evidenced in the Australian asset-backed market, particularly in the market for RMBS. Activity in the RMBS market was better in FY2013-14 compared to the previous year. Overall, FY2013-14 RMBS issuance totalled 34 deals worth A$28.98bn (Australian tranches only) well ahead of the previous year with 32 deals and A$28.31bn issued. The biggest issuers for FY2013-14 were Commonwealth Bank of Australia (Medallion Trust) with A$5.71bn, Westpac Banking Corporation (WST 2014-1) with A$4.75bn, Macquarie Securitisation Limited (PUMA 2014-1) with A$2.65bn, ING Bank Australia (IDOLT 2014-1) with A$2.25bn and Resimac (Resi 2013-1X) with A$1.97bn.
Foreign investor demand for Australian RMBS has been quite high, reflecting the lack of supply of RMBS in foreign markets, the global search for yield, and confidence in the high quality of the underlying collateral of Australian RMBS.
Copyright The contents of this document are copyright. Other than under the Copyright Act 1968 (Cth), no part of it may be reproduced or distributed to a third party without FIIG’s prior written permission other than to the recipient’s accountants, tax advisors and lawyers for the purpose of the recipient obtaining advice prior to making any investment decision. FIIG asserts all of its intellectual property rights in relation to this document and reserves its rights to prosecute for breaches of those rights.
Disclaimer Certain statements contained in the information may be statements of future expectations and other forward-looking statements. These statements involve subjective judgement and analysis and may be based on third party sources and are subject to significant known and unknown uncertainties, risks and contingencies outside the control of the company which may cause actual results to vary materially from those expressed or implied by these forward looking statements. Forward-looking statements contained in the information regarding past trends or activities should not be taken as a representation that such trends or activities will continue in the future. You should not place undue reliance on forward-looking statements, which speak only as of the date of this report. Opinions expressed are present opinions only and are subject to change without further notice.
No representation or warranty is given as to the accuracy or completeness of the information contained herein. There is no obligation to update, modify or amend the information or to otherwise notify the recipient if information, opinion, projection, forward-looking statement, forecast or estimate set forth herein, changes or subsequently becomes inaccurate.
FIIG shall not have any liability, contingent or otherwise, to any user of the information or to third parties, or any responsibility whatsoever, for the correctness, quality, accuracy, timeliness, pricing, reliability, performance or completeness of the information. In no event will FIIG be liable for any special, indirect, incidental or consequential damages which may be incurred or experienced on account of the user using information even if it has been advised of the possibility of such damages.
FIIG provides general financial product advice only. As a result, this document, and any information or advice, has been provided by FIIG without taking account of your objectives, financial situation and needs. Because of this, you should, before acting on any advice from FIIG, consider the appropriateness of the advice, having regard to your objectives, financial situation and needs. If this document, or any advice, relates to the acquisition, or possible acquisition, of a particular financial product, you should obtain a product disclosure statement relating to the product and consider the statement before making any decision about whether to acquire the product. Neither FIIG, nor any of its directors, authorised representatives, employees, or agents, makes any representation or warranty as to the reliability, accuracy, or completeness, of this document or any advice. Nor do they accept any liability or responsibility arising in any way (including negligence) for errors in, or omissions from, this document or advice. Any reference to credit ratings of companies, entities or financial products must only be relied upon by a ‘wholesale client’ as that term is defined in section 761G of the Corporations Act 2001 (Cth). FIIG strongly recommends that you seek independent accounting, financial, taxation, and legal advice, tailored to your specific objectives, financial situation or needs, prior to making any investment decision. FIIG does not make a market in the securities or products that may be referred to in this document. A copy of FIIG’s current Financial Services Guide is available at www.fiig.com.au/fsg.
The FIIG research analyst certifies that any views expressed in this document accurately reflect their views about the companies and financial products referred to in this document and that their remuneration is not directly or indirectly related to the views of the research analyst. This document is not available for distribution outside Australia and New Zealand and may not be passed on to any third party without the prior written consent of FIIG. FIIG, its directors and employees and related parties may have an interest in the company and any securities issued by the company and earn fees or revenue in relation to dealing in those securities.