by
Elizabeth Moran | Sep 25, 2012
Over the last 18 months or so we’ve witnessed the outperformance of the lowest risk securities in the fixed income asset class. Government bonds have been stand out performers with returns over 20% (see the article “What’s your return?”). However, the announcement of quantitative easing three (QE3) in the US and the positive comments made by Mario Draghi regarding the European debt crisis in recent weeks, have reduced the market perception of risk and as a result higher risk fixed income assets, with higher yields (such as over-the-counter hybrids) have outperformed.
The market is very much of the stance that “risk is on”. This means investors perceive that the risk of default by bonds issuers has declined and that they are more comfortable adding higher risk assets that provide higher coupon returns to their portfolio. The rally has seen higher risk bond prices rise and yields fall.
The Australian iTraxx
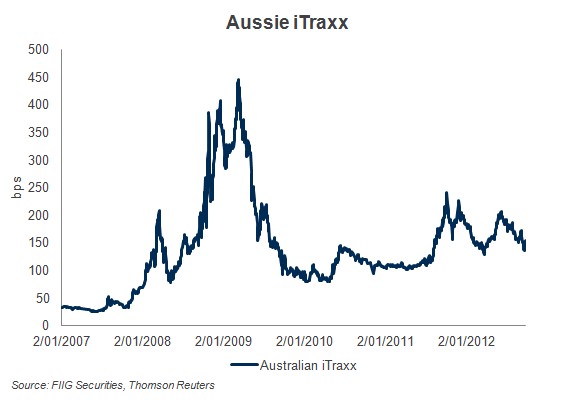
One of the ways we measure the market perception of risk in the bond market is by using the Australian iTraxx. Just like the All Ordinaries Index which measures the daily performance of equities, the Australian iTraxx uses credit default swap (CDS) indices to measure the perceived risk of the bond market (see Figure 1). The higher the dark blue line; the higher the perceived risk. CDS can be used like insurance for institutional bond investors and are sold in minimum $10m parcels, allowing professional investors to buy or sell protection against the risk of default of a set of the most liquid bonds in the market. Movements in the iTraxx are a good indicator of the yields in the overall market. Pre GFC the yield above the benchmark 3 month BBSW was less than 50 basis points (bps), during the GFC it peaked at just over 450bps. Early June 2012 the Aussie iTraxx hit another high point, but from that date begins to decline. This graph tells us that credit spreads (a measure as to the cost to issue debt in the market and the market’s perceived risk) have declined. Remember when yields decline bond prices rise.
The Aussie iTraxx comprises 25 entities which have a set of requirements in terms of membership determination:
- The entity has to be listed on the Australian Stock Exchange (ASX) and have a five year CDS
- All entities must be investment grade as rated by three major rating agencies (S&P, Moody’s and Fitch). This translates to Baa3 by Moody’s, BBB- by S&P and Fitch
- Market makers submit a list of the most liquid traded entities for the previous 12 months to the International Index Company (IIC). IIC then computes final liquidity ranking for each entity. The entities making the iTraxx are the top 25 as per the IIC final list
- All constituents have equal weighting of no more than 4%
- No more than 5 banks can be included in the Index, thus comprising no more than 20% of the total weighting

Figure 1
Bond issuance
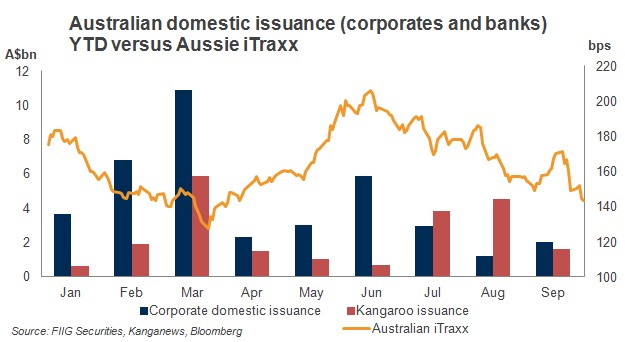
The iTraxx showed us that the market perception of risk has declined as well as the cost of debt. This means that we expect there will be increased issuance in the short term. See Figure 2 below, which shows significant issuance last March when the Aussie iTraxx hit a low of around 130bps. The navy columns represent corporate domestic issuance and the red column kangaroo issuance (that is bonds issued in Australian dollars by foreign banks and corporations). September issuance still appears low but is only to Friday 21 September.
Today Bendigo and Adelaide Bank announced that it was issuing an A$125m Tier 1 hybrid and the margin would be in the range of 500-550bps. The issue will comply with Basel III regulations. Last week it was also reported that Suncorp Metway was preparing to issue an ASX listed hybrid as well, but there has been no formal announcement.

Figure 2
The local market
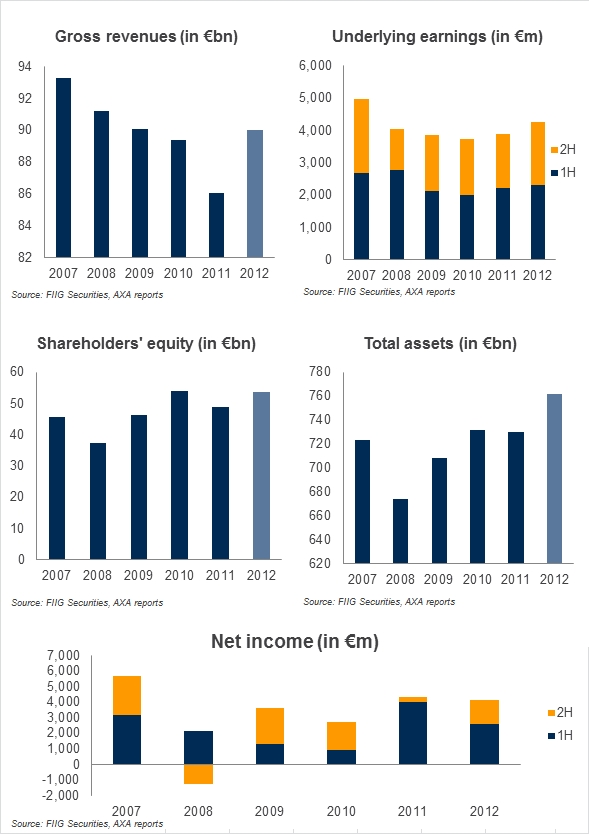
The spread contraction of the bonds means the prices have increased. One of the bonds in my model portfolio, AXA SA A$ fixed, an over-the-counter hybrid (see “Eureka portfolio returns almost 10%”) has rallied, with the fixed rate bond price increasing from $81.25 on 1 June 2012 to $92.25 20 September 2012 or an equivalent 13.5% appreciation in less than four months (see Figure 3). The floating rate note has also rallied, but to a lesser extent moving from $72.25 to $79.50 (10.0%), still a very good return over a short period.
The price of the AXA SA fixed hybrid has been low for quite a while due to concerns over the European debt crisis. As the perceptions of risk have declined, investors have bought back into this security and the price has risen.

Figure 3
If we compare the ASX listed Westpac Trust (WCTPA) price, we find that it was $87.85 as at 1 June 2012 and has declined $87.40 to (-0.5%) as at 20 September. Given the trends we’re witnessing in the wholesale market I would have expected some price appreciation. Admittedly none of the listed hybrids have reflected the lows of the AXA SA hybrids, but it would seem ASX listed retail investors don’t have the same insights as to the changing perception of risk.
The big question with this rally is “has risk actually declined”? It has in a global sense that there’s likely to be a lot more liquidity floating around and European sovereigns and their banks in particular are unlikely to fail in the short term. European sovereign debt issues remain as do tough austerity measures needed to bring debt under control. The US market is different in that the S&P has rallied hard given corporate America is in good shape. But sovereign debt keeps climbing, have a look at the link http://www.usdebtclock.org/. US debt is literally climbing before our eyes. So, to my way of thinking underlying issues remain and the “risk on” strategy could easily swing back to a “risk off” strategy based on even the slightest negative sentiment. We have seen these risk on/risk off swings repeatedly over the last 12-18 months as market bulls fight against ongoing negative fundamentals.
Understanding and pricing risk is an important element of investing. Market perception can change quickly providing opportunities to investors.