by
Dr Stephen J Nash | Oct 02, 2012
Most self managed super funds have an abundance of two assets; equities and cash. Most feel that cash is the best thing to have when equity markets are weak, yet this article questions that idea. Also, given the expectation that the best in equity markets may have been for 2012, one needs to know whether cash, or bonds, are the best asset to have when equity markets are weak.
In this piece, we will review the theory and the practice of the cash versus bond decision. On the theory side, we consider the impact of interest rate risk on the relative performance of cash and bonds. On the practice side, we look at the way bonds perform when equities suffer. Accordingly, with all that cash sitting in accounts of the SMSF sector, one wonders if bonds are a much better place to be, given the profit taking occurring after recent central bank interventions.
Theory
In theory, it is expected that fixed rate bonds will outperform cash when equity markets are weak because fixed rate bonds have much more interest rate risk, when compared to cash. Interest rate risk is the sensitivity of a security to changes in secondary market interest rates, or what interest rate the market is prepared to accept for purchasing a security with a fixed coupon and maturity.
For example, if a bond is issued today with an assumed RBA cash rate of 3.5%, on 3 October 2012, with a ten year maturity, of 3 October 2022, and a fixed coupon of 5%, then that bond would have a sensitivity to a 1% change in interest rates of about 7.79; the bond price will rise by 7.79% if the secondary market purchase yield falls 1%, and the opposite is also the case. Hence, the bond is bought today, and the secondary market for that bond adjusted yields down exactly 1 full percent, so that the yield went to 4%, a capital gain would be around 7.79% (the bond purchased today sold at 5% for a yield of 4%). Typically, bond markets express this sensitivity in years, or 7.79 years of “modified duration”. As modified duration goes higher, so does the sensitivity of the bond to changes in secondary market yields. Cash lacks this sensitivity, and therefore does not increase in market value as yields fall.
One of the main factors that impacts the secondary market pricing of these securities is the perception of growth and inflation in the economy, as the fixed coupon is worth relatively less, the higher inflation goes. This is mainly because inflation eats into the value of the fixed rate coupon stream. Alternatively, when perceptions of growth and inflation are low, then the market values the fixed coupon more highly, as low growth brings lower RBA rates. In turn, lower RBA cash rates tend to lower the entire Australian interest rate structure for all Australian fixed term bonds, all else being equal. In other words, if the RBA rate were to fall from 3.5% to 2.5%, which forces all secondary market yields lower, then our 5% coupon suddenly looks a lot better than when it was issued at 5%. Suddenly, what was plentiful, a 5% coupon issued at 5%, is now scarce, and, as with most things, scarcity tends to increase valuations, all else being equal.
In many ways, the equity market embodies expectations of growth; when returns are strong, then the market is expecting high growth and higher inflation, and when equity markets are weak, the market is expecting lower growth and lower inflation. Accordingly, it is expected, at least in theory, that fixed rate bonds with long maturities will beat cash when equity market returns are weak, as the fixed coupons these products offer become relatively more attractive when short term interest rates are low, and going lower.
Practice
Ok, so we expect that bonds should perform better than cash when equities are weak; now we need to test this in practice. First, we need to select the indicators that give a broad overview of asset class performance. When looking at the performance of asset classes it is necessary to look at a broad range of bonds, cash, and equities. Hence, instead of looking at individual securities, we select the typical market benchmarks, which are typically used by investment consultants, so that our results are not skewed by the performance of one security (1).
Second, we need to test the idea that bonds beat cash by stratifying our sample into increasingly poor equity market performances because if bonds beat cash in weak equity markets, then it would be logical for bonds to beat cash even more, as equity returns were lowered further. Here, we record annual cash and annual bond returns, on a daily basis from 1989 to 2012, when equity markets have the following annual return parameters:
- Annual equity return is less than zero
- Annual equity return is less than negative 5%
- Annual equity return is less than negative 10%
- Annual equity return is less than negative 15%
- Annual equity return is less than negative 20%
- Annual equity return is less than negative 25%
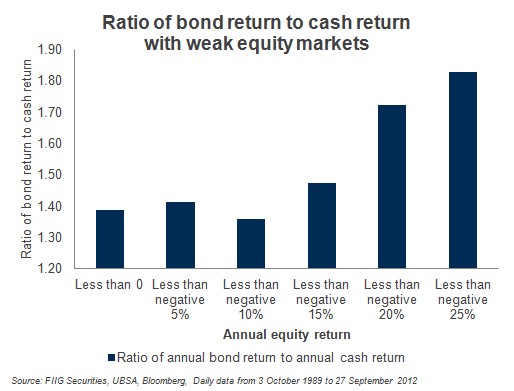
As Table 1 shows, both our expectations are fully met.

Daily data: 3 October 1989 to 27 September 2012
Source: FIIG Securities, UBSA, Bloomberg
Table 1
Notice how bonds beat cash in all situations where annual equity return is negative, by a substantial amount. As equity market returns suffer, that relationship strengthens, as the low growth scenario takes over and the secondary market lowers the purchase yield on longer bonds, thereby forcing prices up. Figure 1 below summarises the results in Table 1 above.

Figure 1
Now, just look at how Figure 2 portrays the relationship between cash and bonds; as things get worse for the equity markets, it is evident that bonds really come into their own. Instead of beating cash by a small margin, bond returns almost double cash returns when equity markets are extremely weak.

Figure 2
Conclusion
Recent central bank interventions did not come as a shock to financial markets. Rather, the good news for this intervention has been built in over more than one year. In many ways, even the best news, which is what was delivered, could not meet the overly optimistic market expectations. A procedure of adjustment, towards more realistic earnings forecasts is now upon us, as we enter the “fall” season for the northern hemisphere, and this should lead equity markets lower in price. As we recommended last week, the best approach to such an investment environment is to be conservative in credit and to prefer longer dated bonds. This recommendation has now been tested in the light of data, which suggests that the current SMSF allocation to cash is excessive, and will not capture enough return in an environment of weak equity markets. Bonds hold the prospect of better return, especially when the prospects for equity performance are as limited as they are right now.
(1) Cash: Daily data, UBS Bank Bill index, 3 October 1989 to 27 September 2012
Bonds: Daily data, UBS Composite Bond index, 3 October 1989 to 27 September 2012
Equities: All ordinaries accumulation index, 3 October 1989 to 27 September 2012