by
Dr Stephen J Nash | Nov 28, 2012
Typically, we use the UBS Composite Bond Index, in order to provide a broad indication of the performance of fixed income as an asset class. However, the index includes roughly 86% of government bonds, so it does not provide an accurate assessment of the risk and return attributes of corporate bonds. Given corporate bonds usually provide greater returns, with only a marginal increase in risk, this article analyses the risk and return aspects of these bonds.
In this note we first look at the structure of the main fixed income index used in Australia, the UBS Composite Bond Index (composite bond index), before looking at the characteristics of the Corporate Bond 3 to 5 year Index (corporate bond index). Some analysis of the risk and return characteristics of the corporate bond index is then performed, especially in comparison to Australian equities.
UBS Composite Bond Index
When we use the Composite Bond Index to describe the risk and return aspects of fixed income in Australia, we are following the industry standard technique, which means the return data is comprised of the following four main sectors:
- Treasury: this sector is comprised of fixed rate securities issues by the Australian Commonwealth government, which represents about 36% of the composite index. These bonds are the lowest yielding in the Australian market, as they offer the best credit quality in the Australian market
- Semi-government: this sector is comprised of fixed rate securities issues by Australian States and Territory governments, which represents about 31% of the composite index. These bonds are the second lowest yielding in the Australian market, as they are perceived by the market to offer the second best credit quality in the Australian market
- Supranational: this sector is comprised of fixed rate securities issues by the foreign supra-national and national sovereigns, which represents about 19% of the composite index. More specifically, the following types of issuers are included: (i) supranational agencies, sovereigns, including provincial or state government debt, (ii) sovereign guaranteed securities with an explicit government guarantee or support from the sovereign, and (iii) sovereign, provincial or state governments. These bonds are the next highest yielding in the Australian market, as the market interprets them to have less credit quality than semi-government bonds
- Corporate: this sector is comprised of fixed rate securities issues by investment grade corporate issuers, which represents about 14% of the composite index. These bonds are the highest yielding in the Australian market, as they are interpreted by the market to offer the lowest credit quality in the Australian market, relative to the other sectors in the composite index. However, the market capitalisation weighted credit rating is quite high, around AA-, so the corporate bond index presents very little credit risk, although it is higher than the rest of the mainly government debt in the composite index.
In other words, the corporate sector is the smallest part of the composite bond index, and this fact is important as the corporate sector offers the highest yield, so that the overall return of corporate bonds is underestimated when using the composite index data.
Corporate bonds
Investment grade corporate debt yields more than government debt because the corporate debt has slightly higher credit risk. This is not to say that all the 3 to 5 year corporate securities are weak credits; the cut-off for inclusion in the index is BBB-, or equivalent for all the three main ratings agencies (the lowest investment grade credit rating), and the issue size needs to be A$100m. The market capitalisation weighted average credit rating for this index is currently considerably above the BBB- limitation, roughly AA-; although the credit composition may vary over time. We use a fixed maturity index in order to reduce the variation in the in modified duration of the index, so that we obtain a fairly constant amount of interest rate risk, over the period used for analysis. Also, the index is very useful in that it provides a broad indication of corporate bond performance and is not impacted by the fortunes of a single security.
Return and risk characteristics
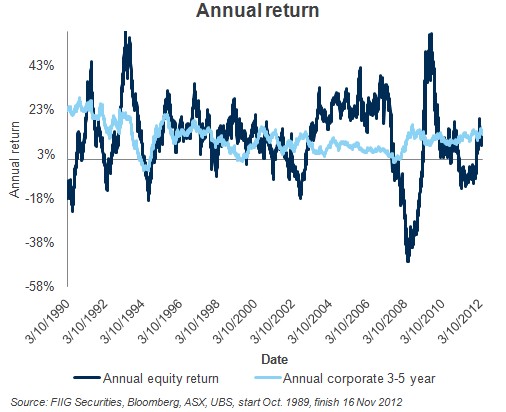
As Figure 1 shows, corporate bonds offer quite competitive return, relative to equities. In particular, notice the steady positive stream of rolling annual return, compared to the erratic and turbulent history for equity returns. While there have been some negative returns, they are few and far between.

Figure 1
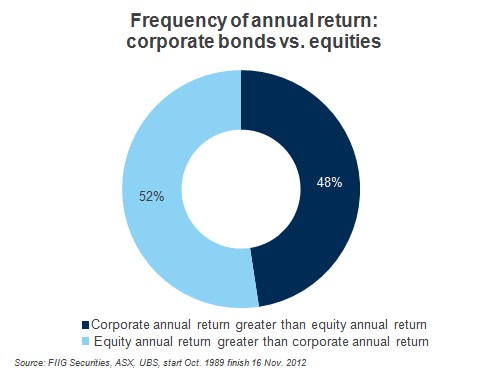
By taking marginally more risk than the composite bond index, the corporate bond investor enjoys a consistently competitive stream of return, even relative to equity return, and Figure 2 shows that corporate bonds can beat equities in a lot of cases, in terms of rolling annual return. Specifically, Figure 2 shows that corporate bonds provide better annual returns than equities almost half the time, over the period from 1990 to 2012, using daily observations, which is the UBS longest data set that is available at this time.

Figure 2
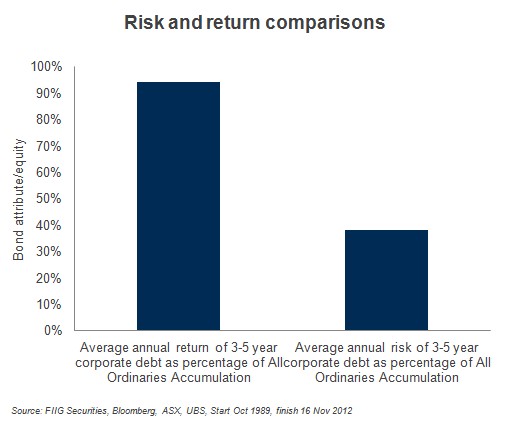
Not only do corporate bonds achieve attractive returns, as they average over 90% of the annual average equity return, they do it in a way that is far less variable, or risky, than equities, with just under 40% of the average annual risk, or variation in return, as shown in Figure 3 below.

Figure 3
Conclusion
Looking at things the way everyone else does, helps in some cases. For example, assessing the characteristics of fixed income, by using the composite index, we align the analysis to market practice.
However, there is a downside.
Specifically, the problem with such analysis is that it weighs the return of the corporate index with securities that have a very low yield; government securities.
By breaking away from the typical analysis, we are then able to see the true benefit of corporate debt, relative to equities. Not only does corporate debt make the lion’s share of equity return, corporate bonds do it in a way that is much more effective, when analysed from the perspective of annual risk. Not only do bonds do a great job on return and risk, they also mature, unlike equities. So, instead of having a perpetual exposure through equities, the bond exposure allows for a regular re-setting of investment return, if conditions were to change. As we have said before, equities appear set to add risk to portfolios, not return, while the opposite is the case with corporate bonds, in an environment where a bond crash remains a distraction, rather than a serious consideration. While sellers of equity risk and products are quick to trash prospects for the bond market, and while we would not respond by doing the same for the equity market, the prospects for bonds seem to us to be much more solid, when compared to equities at this point.