Arguably the biggest advantage of a fixed income investment over other assets classes (equities, property, commodities, etc.) is that, when you enter into the investment, you know upfront your worst-case return on the asset, which is expressed as the yield. You will always get back the par value (usually equivalent to the face value) at maturity, assuming of course that the company does not go bust. The market value of that asset can fluctuate in the interim however, as that value is determined by market demand for the asset (which is in turn driven by movements in credit and interest rates).
Testing your portfolio against adverse movements in yield can reveal the interim worst-case scenario in the market valuation of your bonds. This is accomplished simply by calculating the market value of the asset at a date in the future based on a higher yield and combining that with the income you will have received on the investment up to that point in time. In doing so, you can also calculate your break-even point for that investment (the level at which market profit becomes a market loss).
This is important if you need (or want) to sell the asset before maturity. Different bonds behave differently as markets move. If we compare high yielding bonds with low yielding bonds, we discover some interesting facts. In the following examples we use two theoretical 5-year bonds; one with a low yield and one with a high yield. We then work out the break-even yields on each. For simplicity, we will set the coupon rate equal to the yield on the bond (as though the bond was purchased at the issue date).

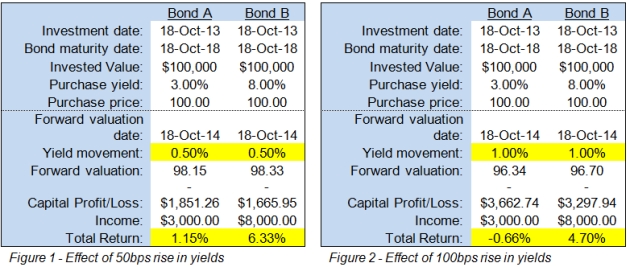
In Figure 1, both bonds are purchased at $100 and valued one year later at yields 50 basis points (bps) higher. The 3% yielding bond has returned a paltry 1.15%, whereas the 8% yielding bond has returned 6.33%. In Figure 2, the bonds are valued at twice the rise in yields, or 100 bps. The 3% yielding bond has now returned a loss of -0.66, whereas the 8% yielding bond has still returned 4.70%.
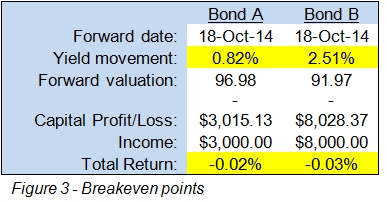
If we take this one step further, we can calculate the breakeven point for both bonds in one year. Figure 3 below shows that the breakeven point for the 3% bond is 82 bps, whereas the breakeven point for the 8% bond is three times that, or 251 bps.

As shown, a high yielding bond may imply higher market risk, but its ability to withstand market shocks is much higher than that of a low yielding bond. This is due to the income received on the higher yielding bond which offsets potential market shocks quickly. It may seem a simple concept, but is often overlooked by investors when considering whether to invest in higher yielding bonds.
The following are the current indicative offer levels on some of our high yield bonds:
- PMP Finance 8.75% 23 October 2017 – yield 8.60%
- Cash Converters 7.95% 19 September 2018 – yield 7.58%
- G8 Education 7.65% 07 August 2019 – yield 7.26%
- Silver Chef 8.50% 14 September 2018 – yield 7.03%
- Mackay Sugar 7.25% 05 April 2018 – yield 6.88%