by
Dr Stephen Nash | Oct 15, 2013
Introduction
In this article we consider the current political climate in the United States in some detail, before looking at a format of fixed income that has extremely strong diversification benefits. Specifically, we:
- Analyse what is happening in the US political scene.
- Consider the volatility of 30 year zero coupon bonds and how their negative correlation relative to equities has assisted portfolio stability.
- Consider the portfolio construction implications of zero coupon bonds.
1. Political risk
Even though the US government shutdown has already occurred, we have emphasised that the current economic climate in the US is very different from the “normal” conditions that existed when the government shutdown occurred last time, in the mid-1990s; when interest rates were not zero and when the Federal Reserve was not trying to stimulate growth through quantitative easing. Over many years, the Federal Reserve has tried to stimulate growth in the US but a default on US debt might bulldoze its efforts. As we get closer to the debt ceiling date, then the following scenarios are most likely; listed in order of likelihood:
- Debt ceiling not passed, but temporary increase passed: It remains most likely that a short term debt ceiling deal will be made. This will extend the current level of uncertainty, while blocking consumption decision-making. How quickly the government shutdown ends, remains an open question, with current estimates for the cost of the current shutdown ranging between 25 and 50 basis points, of US GDP. Extensions from here will mean that US GDP will decline and be close to negative.
- Debt ceiling not passed with no default: It remains unlikely that a default will occur this week. If Congress cannot agree to raise the debt ceiling, then the government will slash spending and try to avoid default. That means, among other things, that the current fiscal drag from the shutdown will be intensified and this outcome will further damage growth perceptions.
- Debt ceiling not passed with default: If the debt ceiling cannot be raised and the US cannot save enough to prevent default, then a default should occur around the end of October or in early November. A default would trigger a banking crisis, as the global debt markets are effectively built around US Treasuries and a default would disrupt the market and may lead to a short term spike in US Treasury yields. However the main impact of a default would be a dramatic decline in growth perceptions, which will lead long yields much lower.
All scenarios are negative for growth perceptions and the current buoyancy in equity markets should soon be replaced with concern, as we enter the northern winter. While the debate concerns the large size of the US deficit, it is effectively a debate about the past. As Larry Summers recently observed, both parties should turn the focus of the debate to the future or the issue of growth as the promotion of economic growth will be the thing that shrinks the US deficit.
If even half the energy that has been devoted over the past five years to “budget deals” were devoted instead to “growth strategies” we could enjoy sounder government finances and a restoration of the power of the American example. At a time when the majority of the US thinks that it is moving in the wrong direction, and family incomes have been stagnant, a reduction in political fighting is not enough – we have to start focusing on the issues that are actually most important (“The battle over the US budget is the wrong fight”, Larry Summers, A small rise in economic growth would entirely eliminate the projected long-term budget gap, The Financial Times, 13 October).
Whether or not the US defaults as a result of an impasse at the end of this week is really beside the point as the damage to the economy is already apparent to many, including the Federal Reserve.
2. Zero coupon bonds
Zero coupon bonds do not pay regular interest payments, yet have the final payment of a typical fixed rate bond. They are bought at substantial discounts to the $100 face value and appreciate in capital value each year until maturity. The bonds are purchased by many investors for divergent reasons. For example, professional investors (like insurance companies) who need to match specific liabilities, while investment banks have used these bonds to guarantee capital protected products, while spending the balance of the portfolio upon “growth” assets.
It is interesting to note the way that zero coupon bonds appreciate over time; how they appreciate with no change in yield. Zero coupon bonds appreciate along with the rate at which they are purchased, so that a TCV 2043, purchased today, might have a value of 19.387, and in one year, the same bond with same yield will be valued at 20.488, meaning the bond will return roughly 5.68%, if the same bond is sold in one year at the same yield that was purchased. In other words, the price of bond rises each year at roughly the same pace as implied by the current yield on the bond. So while no coupon accrues, the bond increases in price if yields are constant, as the price necessarily moves towards $100 and the maturity payment.
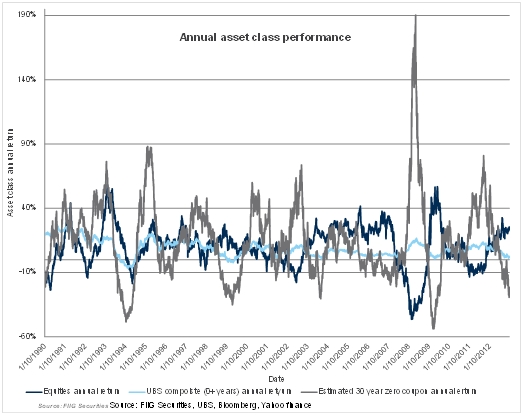
Below, we estimate the performance of zero coupon bonds by using US government 30 year rates from 1989 to 6 May 1994, then US thirty year swap rates from that date until 18 April 2001, and then AUD 30 year swap rates until 25 September 2013. While zero coupon bonds of a 30 year maturity are highly volatile, they have two key advantages:
They attract a higher yield for the higher risk taken.
They generally move in the opposite way to equities and this move is much more dramatic than shorter dated bonds.
As Figure 1 shows, the performance in zero coupon bonds is volatile to say the least, yet the important thing is not the level of volatility, but the typical movement of zero coupon bonds relative to equities. For example, in early February 2009, rates had rallied dramatically, from around 6.90% to around 3.30%, leading the price of the bond to increase, from a total price $13 to a total price of around $37, which is roughly a 183.5% increase, in terms of the initial price of $13, and then the bond experienced a price increase over the year of roughly 6.5%, leading to a performance of roughly 190%.
However, the real beauty of these bonds is the way that the zero coupon bond generally moves, (although not universally) in the opposite way to the equity market. This is because of the way that bond prices move in response to a weakening of perceptions in growth. As perceptions of growth fall, the financial markets begins to expect a cut in the cash rate from the Federal Reserve or RBA, and this causes a surge in bond prices, as we can see in Figure 1, in the year ending February 2009. While 1994 remains a situation where this relationship broke down, the Federal Reserve has repeatedly indicated that better transparency, on behalf of the Federal Reserve, should prevent a repeat of 1994; where the Federal Reserve effectively “sprung” a tightening upon the bond market, without flagging that tightening.
Note how the zero coupon bond outstrips the UBS Composite performance, both in terms of yield and volatility. While the zero coupon bond has an average annual return of 15.12% and average annual volatility of 29.57%, the UBS Composite has an average annual return of 8.86% and average annual volatility of 6.09%. It should be noted that both the UBS Composite and especially the zero coupon bond have benefited from a structural decline in interest rates. However, zero coupon bonds beat the UBS Composite, in terms of yield, because they attract a premium for longer term interest rate risk and they are not weighed down by the heavy government and semi-government weight within the UBS Composite Index. Zero coupon bonds have much larger volatility as they have a much longer modified duration than the UBS Composite Index, which varies around a modified duration of 3.75 years.

Figure 1
3. Portfolio construction and zero coupon bonds
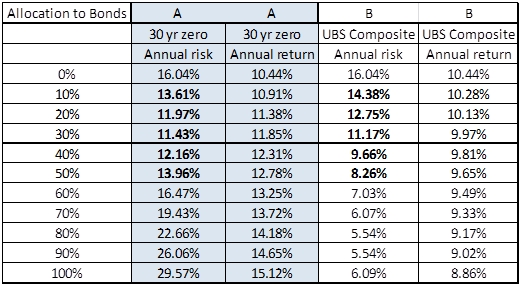
If zero coupon bonds beat the typical benchmark of nominal bonds in Australia, it would be interesting to see how they compare in a portfolio context, to the typical UBS Composite allocation. Here, we show this analysis in Table 1 below, where we show the risk and return for a portfolio of bonds and equities, from 1989 to 2013. In the left column we indicate the allocation to bonds, with the balance being in equities, so 20% represents a 20% bond allocation, and an 80% equity allocation. Then, we vary the bond used between columns A and the columns in B, as follows:
- In the columns under the letter “A” we use a 30 year zero coupon bond, where we show annual risk on the left most column of “A”, and then annual return to the right most column under “A”, and
- In the columns under the letter “B” we use the UBS Composite Index, where we show annual risk on the left most column of “B”, and then annual return in column “B” in the right most column under “B”.

Table 1 (Source: FIIG Securities, Bloomberg, UBS)
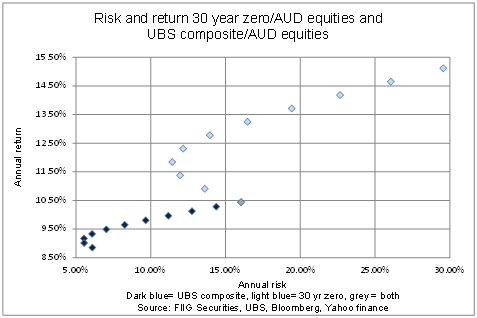
Now, we can chart these results, as shown in Figure 1, in a scatter plot in Figure 2 below. Here, the light blue dots are combinations of equities and zero coupon bonds, in increments of 10%, from 0% zero coupon bond and 100% equities. So a 20% allocation to zero coupon bonds and 80% equities gives an annual risk of 11.97% and a return of 11.38%. Now columns labelled “A” are plotted below in Figure 2 with light blue dots, while columns labelled “B” are plotted as the dark blue dots. While the light blue dots start at the grey dot, and move up in annual return, and initially down in annual risk, the dark blue dots start with a lower annual return, of 100% bonds, and they do the same, where they initially fall in annual risk, as equities are added. However, in both cases, as the equity weight rises, annual risk then starts to rise.
A common point, which has the same risk and return features is the grey dot, with 100% equities and 0% bonds.
Several observations are worth making, as follows:
- Notice how risk falls in both these allocation curves as either UBS Composite or zero coupons are added to equities. In the case of the UBS Composite, notice that as they are added, risk initially falls from around 6% to around 5.5%, as the UBS Composite bond Index is added, right out to 100% UBS where risk is around 16%, and return is around 10.50%.
- If we add small amounts of zero coupons to an equity portfolio, then risk falls, as shown by the light blue dots, given that the zero is very volatile and so negatively correlated with equity return; from around 16% to around 11.50%.
- Using zero coupon bonds is not for the timid, yet, one can switch from a portfolio of 70% equities and 30% UBS composite, to a portfolio of 70% equities and 30% zero coupon bonds, and pick up around 2% additional yield, without increasing risk.
- Zero coupon bond risk gets too volatile to really consider in the higher allocations to zeros, and the allocations that increase risk, past that of the grey dot, or 100% equities, are not recommended; they are provided for explanatory purposes only. In other words, we recommend that you should treat zero coupon bonds on a “handle with care” basis.

Figure 2
Conclusion
Zero coupon bonds remain a very volatile bond format, so volatile that they dwarf equity volatility. While this volatility demands respect, zero coupons really make the most of an allocation to bonds. Specifically, we suggest that if investors have 30% allocated to bonds, and use the UBS Composite 0+ year Index, instead of the thirty year zero coupon bonds, then they are effectively sacrificing 2% annual return, on average for the same level of annual risk, on average. While the structural decline in rates may be skewing this result in favour of the zero coupon bond, it does not eliminate it entirely, and this is crucial for investors to appreciate. Hedging equity risk is something that is becoming more and more pressing as we approach the end of this week, given the debt ceiling negotiations are currently stalled at the date of writing. Even if a short term deal is done, the problem remains that the ongoing stalemate in congress is dampening business sentiment, leading to delays in investment, while also depressing consumer sentiment. Hence, with both the producer and the consumer confused, the way is clear for all the good work of the Fed to be undone by political wrangling in Washington. While we hope that this is not the case, the Fed, and others remain legitimately concerned and so should you.
Specifically, if you can buy a 30 year semi government zero coupon bond a yield of roughly 5.60%, that compares very well to the yields on the UBS Composite Index, with a yield of around 3.70% and a lower weighted average credit rating. Other zero coupon examples would be the TCV 2033 zero coupon at a yield of around 5.55%, or the TCV 2023 zero coupon at a yield of around 4.65%. In other words, you are getting handsomely paid for taking on the risk of a zero coupon bond; a bond that protects the portfolio in a much more effective manner than the shorter term instruments typically used.