by
Dr Stephen J Nash | Dec 12, 2012
This article shows how you can develop an annuity stream from first principles on Microsoft excel, and then inflate that annuity stream for different rates of inflation.
Annuities are very simple; they are an equal repayment over the life of a loan, comprised of increasing principal payments and decreasing interest payments. The present value of an annuity is the value of a series of payments, discounted by the interest rate to account for the payments that are being made at various specified points of time in the future. In many ways, annuities look just like your typical home mortgage payment stream. Such an annuity is also known as a “nominal” annuity, which does not keep pace with inflation.
Inflation indexed annuity bonds (IABs) have the annuity payments, which are indexed to inflation. Here, the equal re-payment amount, (known as the “base payment”) is indexed to inflation, so that the value of the base payment remains constant in “real” terms, or after inflation. All this sounds very complicated, however we will explain IABs in the following four steps, so you can do a few calculations and replicate the entire payment if needed. We show these four steps as follows:
- The total payment function in excel, which you can use to derive the total annuity payment
- The interest payment function in excel, which you can use to derive the interest amount in each annuity payment, and apply it to a specific problem
- The calculation of the principal repayment and show how all the cashflows look for a nominal annuity without inflation
- Various inflation scenarios to inflate the constant base payment and show how dramatically high inflation can impact these payments
1. Total payment formula
Excel formula: PMT (rate,nper,pv,fv,type)
Here are the following inputs to this formula:
- Rate is the interest rate applied for the for the annuity
- Nper is the total number of payments for the annuity. Here, you need to ensure that you are consistent about the units you use for specifying rate and nper. For example, if the issuer makes semi-annual payments on a 10-year annuity at an annual interest rate of 2 percent, use 2%/2 for rate and 20 for nper
- Pv is the present value, or the total amount that a series of future payments is worth now, which is also generally referred to as the “the principal”
- Fv is the future value, or a cash balance you want to attain after the last payment is made. If fv is left out, it is assumed to be 0 (zero), that is, the future value of a loan, on maturity, is 0, and
- Type is the number 0 (zero) or 1 and indicates when payments are due; 0= at the end of the period, and 1= at the start of period
Now that you have all gone to sleep, we might be able to rouse you with an application of these formulas to a real example, where we have a $500,000 indexed annuity bond that pays a nominal 2% rate on interest over 20 half yearly periods or ten years in total.
Now, the first total payment amount is $27,707.66, which is returned from the following PMT function:
PMT = (rate,nper,pv,fv,type), where
- Rate = 2% annual, yet as we are doing semi-annual payments we divide the rate by 2, so we apply a rate of 1% for each semi-annual period, or 2%/2
- Nper = 20 periods
- Pv = $500,000, or initial principal
All these values are therefore represented in the PMT function as follows:
PMT = ((2%/2),20,500,000) x (-1)
We multiply by -1, because the function returns a stream of negative payments that sum to the present value (Pv), or principal amount.
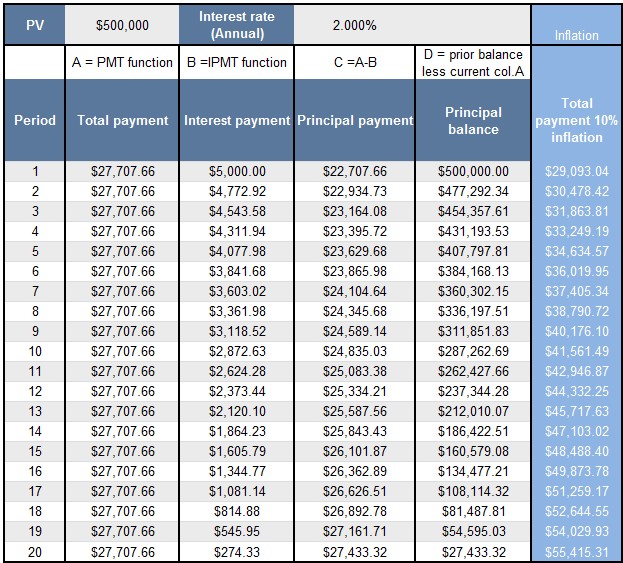
This means that we now have the total principal payment amount for each of the twenty annuity payments. We leave the future value out, so we assume 0 at the maturity, and we leave type out, so we assume payment at the end of the period. Table 1 shows the full workings for all twenty periods.
2. Interest payment formula
Excel formula: IPMT(rate,per,nper,pv,fv,type)
Here are the following inputs to this formula:
- Rate is the interest rate applied per period,
- Per is the period for which you want to find the interest and must be in the range 1 to nper,
- Nper is the total number of payment periods in an annuity. Make sure that you are consistent about the units you use for specifying rate and nper. For example, if the issuer makes semi-annual payments on a ten-year annuity at 2 percent annual interest, use 2%/2 for rate and 20 for nper,
- Pv is the present value, or the lump-sum amount that a series of future payments is worth right now, which is also referred to as “the principal”,
- Fv is the future value, or a cash balance you want to attain after the last payment is made. If fv is omitted, it is assumed to be 0 (the future value of a loan, for example, is 0), and
- Type is the number 0 or 1 and indicates when payments are due. If type is omitted, it is assumed to be 0, and 0 assumes payments are due at the end of the period, and 1 means payments are due at the start of the period.
Now all we have to do is work out the interest figure on the annuity payment, where we have a $500,000 indexed annuity bond that pays a nominal 2% rate on interest over 20 half yearly periods.
Here, the first interest payment amount is $5,000, which is calculated from the following IPMT function,
IPMT= (rate,per,nper,pv,fv,type), where:
- Rate = 2% (we divide the rate by 2, as it is a semi-annual payment)
- Per = 1, or the first period, and this changes for each period, so Per will be 2 for period 2, and 3 for period 3,
- Nper = 20 periods
- Pv = $500,000 or initial principal amount
All these values are therefore represented in the IPMT function as follows:
IPMT = ((2%/2),1,20,500,000) x (-1)
We multiply by -1, because the function returns a stream of negative payments that sum to the Pv, or principal amount.
This means that we now have the total interest payment amount for each of the twenty annuity payments. We leave future value out, so we assume 0 at the maturity, and we leave type out, so we assume payment at the end of the period. Table 1 shows the full workings for all twenty periods. The columns represent:
- Column A has the PMT functions
- Column B has the IPMT functions
- Column C deducts the interest payment from the total payment to obtain the principal payment
- Column D works out what amount of principal is left to pay

Table 1
3. Deriving the principal payment
Simply deduct the interest payment from the total payment, so the first principal payment is as follows:
$27,707.66-$5,000 = $22,707.66
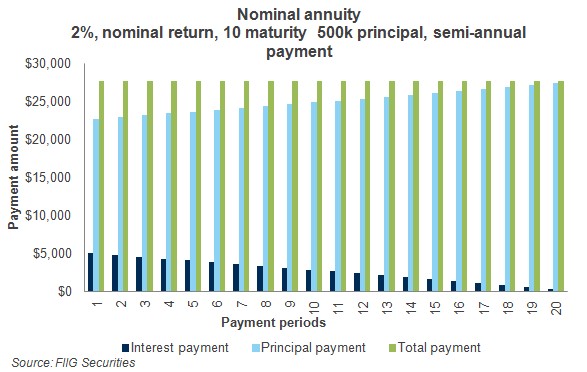
This means that we now have the interest payment amount for each of the twenty annuity payments. We leave future value out, so we assume 0 at the maturity, and we leave type out, so we assume payment at the end of the period. These results can be graphed below in Figure 1. Notice how the green bars are always constant, and the dark blue bars, or the interest payments gradually decline, while the principal payments gradually increase.

Figure 1
4. Inflating the nominal annuity payment
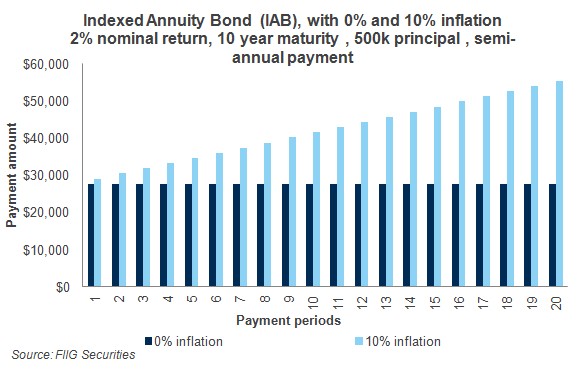
In order to demonstrate how the IABs protect against inflation, we have graphed an example showing 0% and 10% inflation. The dark blue column in Figure 2 shows the 0% inflation assumption while the light blue columns show the extreme 10% inflation assumption. For example, the first total payment is $27,707.66, and we assume that the payment is made at the end of the period. So, if we had 10% inflation for the year, we would have had 5% inflation for the first six months. Hence we multiply $27,707.66 by 1.05 and we obtain $29,093.04. Now, the next period, we multiply the $27,707.66 by 10%, as the annuity payment is fully indexed to inflation.
If inflation were zero over the next ten years, then the semi-annual annuity payment would remain the same, as it appears in Figure 2 below. However, notice how it grows with inflation, and if inflation was 10%, then the impact is very dramatic on the annuity payment*. While the nominal impact is dramatic, the impact on real returns is zero. This is because, in the unlikely event that the inflation rate was to be 10%, the indexing merely returns the nominal values to an amount that keeps pace with inflation. While inflation of this magnitude remains unlikely, investment portfolios need instruments that “rise to the challenge”, and meet such risks, and many investment portfolios just do not have enough inflation protection built in; they are based on a set of very narrow assumptions that fail to capture the reality of investment markets, which have a habit of not only surprising, but testing complacent assumptions.

Figure 2
Relative value
Since indexed annuities trade at more than 3% over the rate of inflation, and the forecast for cash over the next few years is 2.75%, or lower, investors still receive more than the cash rate in an indexed annuity format from a solid credit. This means that the total return on the indexed annuity bond (IAB) should be 3% plus the expected rate of inflation, or 2.50%, so total returns are around 5.50% almost double the anticipated cash rate for 2013. The IAB gives you the flexibility of re-investing principal repayments if market conditions change and if 2012 tells us anything, it tells us that markets can change quickly and substantially.
Moreover, as the honourable Paul Keating has recently observed, if investors need a solid allocation to bonds, so as to mitigate risks, then the IABs mitigate investment risk while also mitigating inflation risk at an attractive rate above inflation. As the Hon. Paul Keating indicates,
For systemic prudential reasons, investment in stable asset classes such as government bonds or higher rated corporate bonds could be desirable for SMSFs - that is, perhaps some form of mandated minimum investment to mitigate downside risks (“The future of super”, Association of Super Funds of Australia 2012 National Conference, 28 November 2012).
Conclusion
While an annuity is probably the simplest payment structure, it is “beset on all sides” by misunderstandings and complications, which really do not assist. One wonders what might be simpler than an equal payment stream. In trying to dispel these misunderstandings, this article provides the tools required to derive the annuity cashflow, and then to inflate that cashflow. When you can obtain more than the medium term cash rate, in a real return format for an IAB, then there is a compelling case for investment. Rates are not rising anytime soon, and getting in front of the rush for yield makes sense, as the low rate environment will force more and more value to be taken out of IABs, as we proceed through 2013. Protection against inflation should be an important consideration for all portfolios, and the IAB, which releases principal over the life of the security, allows investors to re-invest in other opportunities as they arise.
* FIIG is not forecasting 10% inflation, with the central forecast being around 2.50%, going forward.