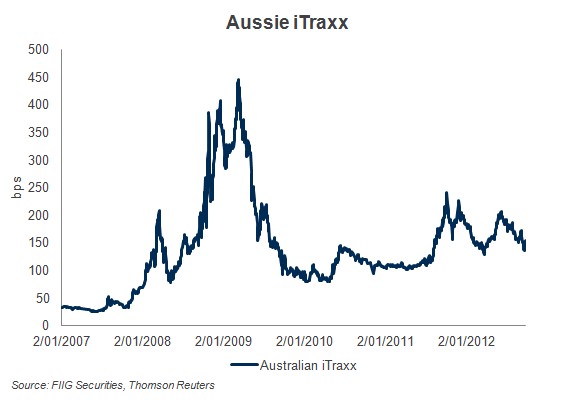
The Australian iTraxx Credit Default Swap (CDS) Index tracks the performance of Australian corporates and is an indicator of credit risk for investment grade entities.
The charts below show performance over one month and one year. Credit risk is perceived by the market to be falling.

Bond market in review
The RBA cut the cash rate to a record-equalling low of 3.0% on 5 December 2012. However it didn’t have much impact on the market with participants looking for further easing in 1H13. The RBA itself highlighted low rates are part of the ‘new normal’ and seemed keen to signal we are not yet at emergency settings, nor facing any floor that inhibits the effectiveness of policy or future easing.
On the global front, markets were heartened in late November by the news that Greece has received another debt support deal. However, markets viewed Eurozone tail risks as benign compared to those associated with the US fiscal cliff. Fears over the fiscal cliff put upward pressure on global bond yields in the run up to the end of the year. Once some form of agreement was reached in early January, markets accordingly responded positively as reflected in Aussie iTraxx which tightened some 7bps overnight into the New Year.
Credit spreads
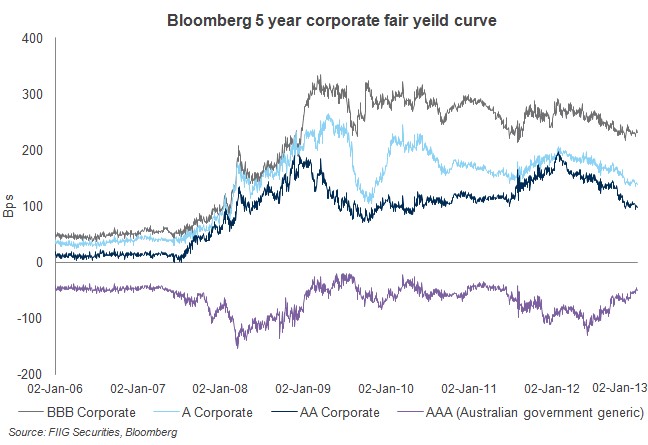
This data in the chart below is taken from Bloomberg Fair Market Curves. The spreads are based on a five year maturity representing the composite yield of securities around that maturity for each ratings band.
Spreads at 10 January 2013:
| AAA | -51.05 |
| A | +97.02 |
| A | +138.32 |
| BBB | +231.11 |

Facilitation desk top buys
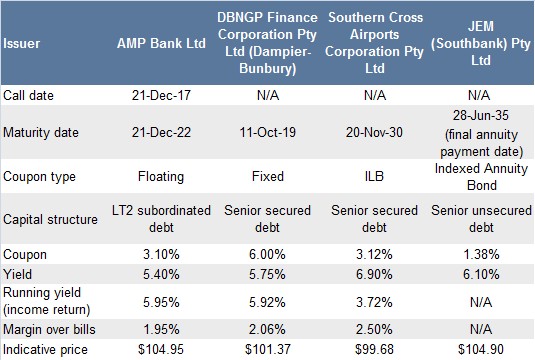
Our traders do a great job sourcing bonds for us to buy and sell. Below are their top five buys.

Selection for top buys is from the sales team, is not research and is based on:
- Favoured credits
- Securities exhibiting the strongest risk/return relative value
- Consistently strong availability of stock at or around indicated prices
Yield for Floating Rate Notes is the swap rate to Maturity/Call plus the trading margin.
Yield for ILB equals Real Yield plus a current inflation assumption of 2.5%.
ILB running yield quoted is a commencing value, given current indexation, but will accrete up with inflation.
All prices are a guide only and subject to market availability. FIIG does not make a market in these securities.
Note from the facilitation desk
There has been a growing disparity in the pricing of credit in the AUD bond market with respect to offshore markets, which offshore institutional buyers are catching onto. Counter to this, new issuance has been lower than expected and market offers are thin. In short, demand is outweighing supply, which is resulting in a jerky transition to tighter credit spreads. The implications for investors are:
- Thin market supply in bonds, meaning orders are taking longer than normal to be filled
- More liquid, highly rated corporate lines are more expensive
- Less liquid lines like infrastructure exhibit stronger value relative to more liquid paper such as banks, financials and top tier corporations (Telstra, Wesfarmers, etc). Clients looking for the best risk to return payoff are steering toward infrastructure bonds like DBNGP, Sydney Airports, and JEM (Southbank)
Indexed Annuity Bonds (IABs): A different approach to cashflow management
Our “flavour of the month” are indexed annuity bonds (IABs).
Many of our SMSF clients have expressed strong interest in including Annuity-style bonds in their portfolios, especially those in pension phase who are required to drawdown specified percentages annually from their SMSFs. These are a simple and easy way to generate an inflation-protected cashflow to cover regular expenses like water/ electricity/ utilities/ food bills from a defensive asset.
The JEM Southbank 2035s are in strong supply, and are available at an attractive yield of 6.10%.
For more information you can access our weekly market data and transparency report by clicking on the link in The WIRE each week.