JP Morgan reported record net income of US$5.7bn which it attributed to strong business performance across the company's major business lines. This result was also supported by the housing recovery in the US with the CEO, Jamie Dimon stating that the housing market "has turned a corner." He noted however, that the bank was still seeing a high level of souring mortgage loans, and said he expects high default-related expenses "for a while longer."
The bank gave few details on the surprise US$6bn trading loss that dominated its previous earnings report. The Chief Investment Office (CIO), the proprietary trade unit responsible for the losses, took another US$449m loss on that portfolio. However the bank said that the positions at the CIO had finally "closed out".
Profitability
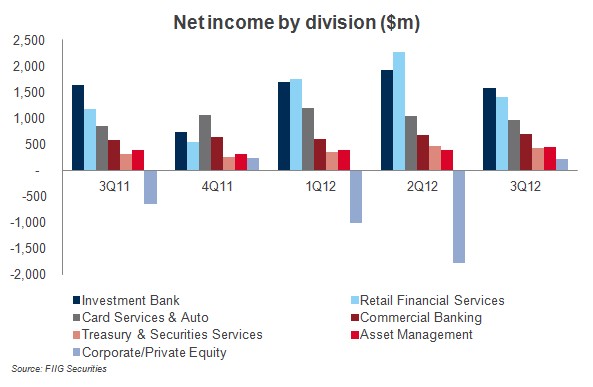
Net income was US$5.7bn up 34% from the prior year (including a negative debt valuation adjustment of US$211m and a gain on trust preferred capital debt securities (TruPS) redemption of US$888m). The solid result was mostly due to stronger investment banking revenue, largely because of strong debt underwriting results and favourable year over year comparisons. Retail financial services benefitted from continued strong mortgage volume, reflecting historically low mortgage rates and high margins (see Figure 1 below).

Figure 1
Investment Bank Net income was US$1.6bn, down 4% from the prior year. These results reflected higher non interest expense and lower net revenue, largely offset by a benefit from the provision for credit losses compared. Net revenue was flat at US$6.3bnversus US$6.4bn in the prior year. Net revenue included a US$211m loss from a debt valuation adjustment on certain structured and derivative liabilities resulting from the tightening of the bank’s credit spreads compared with a gain of US$1.9bn in the prior year.
Retail Financial Services Net income was US$1.4bn, compared with $1.2bn in the prior year. Net revenue was up 6% to $8.0bn. Net interest income was $3.9bn, down 5%, driven by lower deposit margins and lower loan balances due to portfolio run-off, largely offset by higher deposit balances. Non interest revenue was US$4.1bn, up 19%, driven by higher mortgage fees partially offset by lower debit card revenue.
Card Services & Auto Net income was up 12% to US$954m. The increase was driven by lower non interest expense and lower provision for credit losses, partially offset by lower net revenue.
Commercial Banking Net income was up 21% to US$690m. The improvement was driven by an increase in net revenue and lower provision for credit losses, partially offset by higher expense.
Treasury & Securities Services Net income was up 38% to US$420m.
Asset Management Net income increased 15% to US$443m, reflecting higher net revenue, lower non interest expense and lower provision for credit losses.
Corporate/Private Equity Net income improved to US$221m, compared with a net loss of US$645m in the prior year. Treasury and CIO reported net income of US$369m, compared with a net loss of US$94m in the prior year. Net revenue was US$713m, compared with net revenue of US$102m in the prior year. The current quarter revenue reflected US$888m of pretax gains related to the redemption of trust preferred capital debt securities (bought back at a discount).
Credit quality/provisions

Source: FIIG Securities, Company report
Figure 2
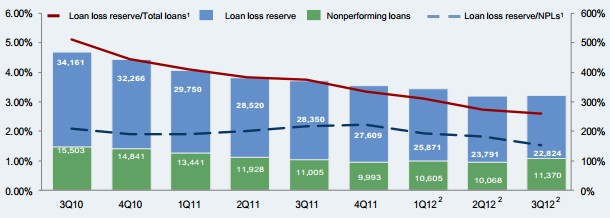
Total provisions for credit losses decreased 26% from the previous year to US$1.8bn (see Figure 2). Total consumer provisions were US$1.9bn (down US$432m from the prior year) reflecting a US$900m reduction related to the mortgage portfolio due to improved delinquency trends and lower estimated losses. Consumer net charge-offs were US$2.8bn, compared with US$2.7bn in the prior year. The increase was primarily due to incremental charge-offs of US$825m for certain residential loans reported in accordance with regulatory guidance.
The wholesale provision recorded a benefit of US$63m compared with an expense of US$127m in the prior year. Wholesale net recoveries were US$34m, compared with net recoveries of US$151m in the prior year.
The bank’s non performing assets totalled US$12.5bn at September 30, 2012, up from the prior-quarter level of US$11.4bn and flat compared with the prior-year level of US$12.5bn.
Trading losses Positively, risk from JPMorgan's synthetic credit portfolio, which resulted in significant trading losses in the first two quarters, has been significantly reduced. The portfolio generated only a modest loss in the third quarter.
An internal assessment of the company's risk management practices by its Board of Directors is underway.
PIIGS PIIGS exposures remains manageable, but a worsening of the European crisis could still have a notable impact.
Capital

Table 1
The bank increased capitalisation over the quarter as shown in Table 1 above. We also note that the bank estimates its Basel III Tier 1 common ratio at 8.4% up from 7.9% in the second quarter.
While JP Morgan ceased its share buyback program following losses in the CIO, they may resume such activity if it re-submits its capital plans and receives approval from the Federal Reserve - which it is likely to do in the coming months.
Recent issuance
Following the solid results, JP Morgan wasted no time in issuing debt. Overnight the bank issued US$2.25bn fixed rate 3 year bonds at T+77bps (approx AUD swap+95bps) and US$600m of 3yr FRNs at L+66bps.