by
Dr Stephen J Nash | Sep 25, 2012
It has been a big few weeks for financial markets. Over the recent past, we have emphasised that investors should be increasingly careful into the anticipated quantitative easing from the US authorities (QE3). Accordingly, this note reviews developments after QE3, as well as changes by the RBA.
First, we see how QE3 has impacted the pricing of longer US Treasuries. Second, we review recent RBA changes and the implications for the pricing of longer dated Australian government securities. Third, we consider the recent equity and credit market rallies. Finally, some implications for fixed income portfolios are drawn.
1. US 10 year cheap
Recently, the US has seen a rally in nominal (fixed rate) bond markets, with a dramatic flattening of the interest rate spread between the 5 year and the 2 year US Treasury bonds, as shown by the grey line in Figure 1 below. While the shorter part of the curve has responded to the recent quantitative easing (QE3), as shown by the grey line, the blue lines in Figure 1 indicate that this has not occurred in the longer end. This means that the longer end of the US Treasury curve has not followed the developments in the shorter end. Over time, we expect that this situation will be reversed, as longer spreads narrow, and the curve flattens, in line with Fed requirements. Accordingly, longer yields should fall, all else being equal.
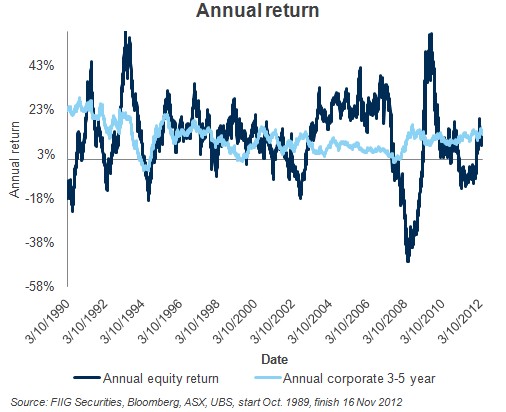
Figure 1
Looking at the recent history in more detail, the drift in the ten year becomes evident. On the left hand axis is the spread between the US 5 year Treasury, with a yield of say 0.71% and the 2 year US Treasury, with a yield of say 0.25%, meaning the difference in yield between the two points of the curve, or the “interest rate spread” is 0.46%. On the right hand axis, we look at the same type of spread for the 10 year less the five year. Notice how the longer spread, the 10 less the 5 year, has moved out substantially, post QE3, while the shorter spread has remained largely constant. Going forward, we expect the light blue line to move back towards the dark blue line, as it did in April to May of this year, as the market reluctantly accepts the objective of the US Federal Reserve; to have longer rates lower, as to stimulate economic growth. Right now, however, the longer end of the US market is concerned that the US Federal Reserve is abandoning the inflation target and only adopting the employment target. Also, the market has taken profit on the long awaited advent of QE3. As these issues dissipate, and as the market begins to accept that the US Federal Reserve is still paying attention to inflation. We anticipate the light blue line will approach the dark blue line, which means that the US ten year should fall in yield, or that the 10 year part of the US curve represents a “buy”.
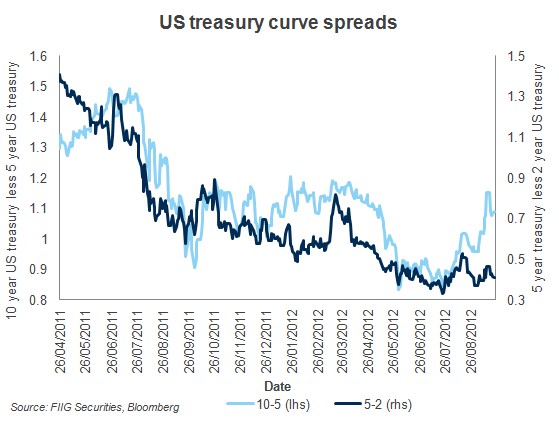
Figure 2
2. RBA easing bias in place
As we argued recently, there has been a change of heart at the RBA. Some local commentators, such as Chris Joye in the Australian Financial Review, have legitimately argued that recent easings have energised the property market, and that further easing may lead to a price explosion in a society that is obsessed with property (1). It can be anticipated that the RBA will be very aware of these arguments, and would sympathise. These concerns have probably already led the RBA to wait before further easing.
Without the influence of the business leaders on the board, the RBA might well be able to leave rates where they are. However, the business community is fuming about the level of the AUD, and while the RBA has forecast the decline in the terms of trade, it has not forecast the level of the AUD. It is the persistently high AUD which is effectively dismantling Australian manufacturing and easing will not impact the level of the AUD that much, yet it will ease funding pressure on business.
However, we expect that further easing would not cause a wholesale change in sentiment; the consumer is likely to remain conservative. Accordingly, maybe one easing could be a possibility, as a further adjustment to the prior cycle; not a new cycle. While the business leaders want more than one, the RBA wants nothing. Also, one easing with full flow through seems feasible given recent easing of bank funding pressure. Given the RBA easing bias we will, all else being equal, see the AUD/US 10 year spread contract. This makes the AUD 10 year bonds somewhat inexpensive, especially in the context of a US 10 year that remains cheap after the recent delivery of QE3, and the profit taking that came along with QE3. Over time, one can expect this situation to be reversed, so that
- US 10 year government fall in yield
- AUD 10 compresses to US 10 year government yields
RBA easing bias and long end spread to US
In general, the interest rate spread, between the US market and the Australian market, is governed by perceptions of relative tightening, or easing of Australian monetary policy, with an 84% correlation using daily data from 8 April 2010 to 24 September 2012. Hence, when the market perceives that Australia is tightening (increasing interest rates), relative to the US, the spread in the ten year areas will widen, relative to the equivalent US ten year bond. Also, when the market perceives that there is an easing bias by the RBA and that US policy remains unchanged, then the long end spread should contract, all else being equal.
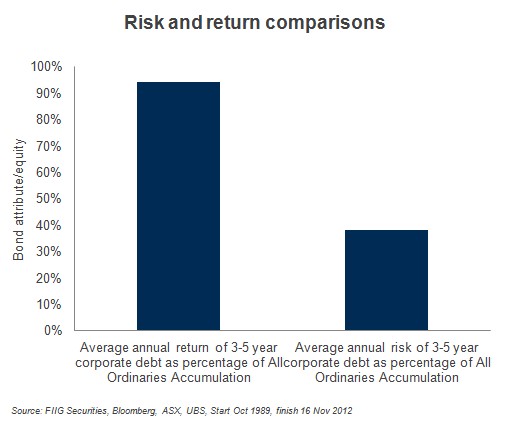
Figure 3
As argued above, the RBA has, reluctantly, moved toward an easing bias, and this easing is rather dramatically shown in Figure 4 below, by the dark blue line. Such a fall in spread in the short end will support a lower level for the level of Australian 10 year rates, relative to US rates.
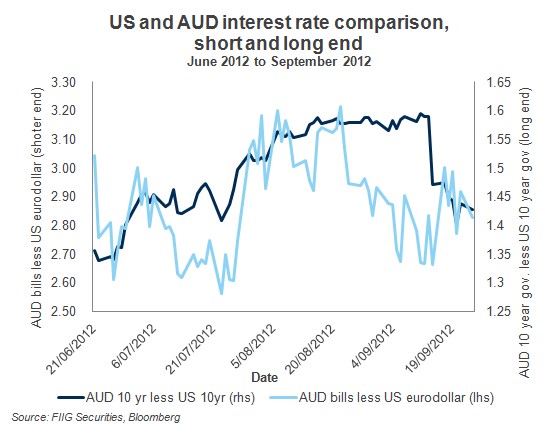
Figure 4
3. Credit and equity rally
As we mentioned recently, expecting the local equity market to provide more than 15% annual return, is somewhat optimistic. Recently, we hit 15% annual return just before QE3, and the market has been coming away ever since.
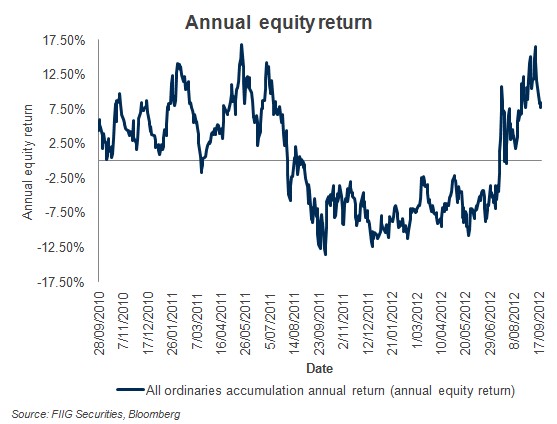
Figure 5
Credit has also been doing very well, and we can gauge that by looking at the performance of each of the major bond sectors in the 3-5 year area, versus the major index in the Australian market, the Australian UBS Composite Index. In figure 6 we show that credit has done well of late, and this performance has been supported by the rally in equities.
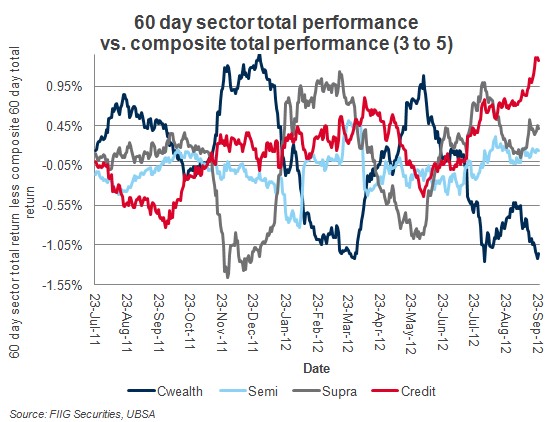
Figure 6
Equity rallies and credit rallies are typically associated with low equity market volatility, and the barometer of equity market volatility, the VIX Index, has been low of late; much lower than it is typically is around September and October (2). As volatility rises, prices should slide, as the market comes toward a more realistic idea of earnings for 2013, as shown in Figure 7 below.
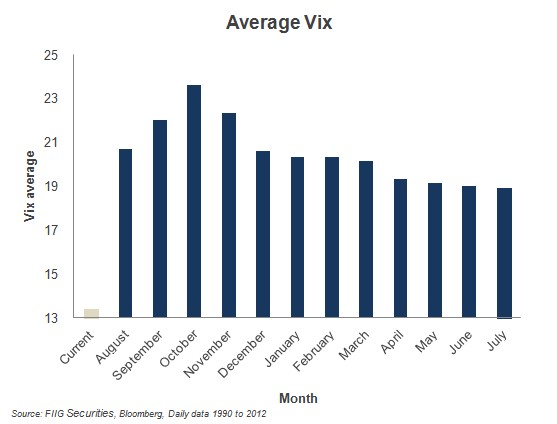
Figure 7
Implications for a fixed income portfolio
These developments have several implications for the setting of fixed income portfolios. My suggestions are:
1. Be conservative on credit
Faced with the choice between a higher yielding security and a lower yielding security, the above analysis suggests that investors should prefer the lower yielding security, or portfolios should “lighten up’ on holdings of higher yielding securities. Among other things, investors should reduce:
- Tier 1 and Tier 2 exposure in favour of senior exposure, so switch Swiss Re/ AXA SA Tier 1 hybrids into major Australian bank senior
- Exposure to issuers in non-Australian jurisdictions, in favour of Australian securities. For example, switch European bank senior debt exposure, like BNP, to Australian senior bank debt, like CBA
- Decrease financial exposure and increase non-financial exposure, with better or equivalent credit quality. For example, switch from Bank of Queensland debt to Sydney Airport debt
2. Add interest rate risk
Faced with the choice between nominal bonds, prefer securities with longer maturities. Among other things, investors should do the following:
- Reduce floating rate note exposure in favour of fixed rate nominal
- Reduce short fixed rate exposures in favour of longer fixed rate
- Prefer longer inflation linked bonds to shorter inflation linked bonds
(1) “House prices rising across Australia”, Australian Financial Review, 20 September 2012, http://www.afr.com/p/blogs/christopher_joye/house_prices_rising_across_australia_hkdM7R7ESoIf3dbsOkaU4M
(2) Chicago Board Options Exchange Market Volatility Index, represents a measure of the implied volatility of S&P 500 index options.