Introduction
In “Sequencing risk Part 1” we looked at a simple definition of sequencing and how portfolio volatility can vary the impact of sequencing risk, whereas in “Sequencing risk Part 2”, we looked at some “real life” examples of sequencing risk and how large sequencing risk can be. In this article, we now add annual return expectations and see how sequencing can impact those expectations, as well as looking at the issue of how portfolio size can grow significantly, relative to contributions, especially later in the life of an investor. Hence we provide the following analysis steps within this article:
- The volatility of a 75% equity 25% bonds portfolio relative to a return expectation of 4% over inflation.
- Historic achievement of a target return of 4% over inflation using the above asset allocation.
- The market value of a portfolio versus total contributions and how market value can dwarf contributions, near retirement.
Part 1 - Sequence risk and real return
Most investors in defined contributions (DC) schemes have expectations of return that are very similar to those of defined benefit (DB) schemes. Defined contribution schemes are where the contributor takes the risk of the investment outcomes, while the DB schemes are where the provider takes the investment risk of the scheme, and typically provides a return that is a margin over the CPI. In Australia, most investors appear to expect a return of around 4% over the CPI, and some major funds, like the Commonwealth Future Fund, target returns as a percentage over the CPI, as we note below,
The Board is to adopt an average return of at least the Consumer Price Index (CPI) plus 4.5% to 5.5% p.a. over the long term as the benchmark return on the Fund (Future Fund, Statement of Investment Policies, February 2012, p.4).
Now, if one reviews the two sequences of annual total return, both the actual, and the reverse sequence, relative to the expectation of a rolling annual 4% real return, we can see that the return stream is extremely volatile, relative to this expectation, assuming we were to use the supposed “balanced” asset allocation of 75% US equities (S&P 500) and 25% US bonds (10 year swap plus 100bps.). While the exact correlations between both of the return sequences, and the US CPI plus 4% vary, both are near zero; the return stream is not significantly related to the rate of inflation plus a margin of 4%. In other words, expectations of economic growth and recession dominate the highly volatile return stream, relative to the CPI and these expectations effectively drive the fortunes of portfolio return, relative to what remains the typical return expectation of CPI plus 4%.
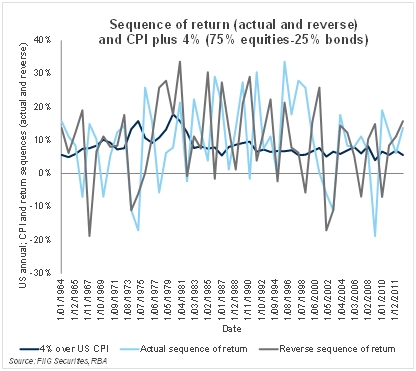 Figure 1
Part 2 - Sequence risk and investment expectations
If we then review the performance of the 75% equity - 25% bond portfolio against the expectation of 4% plus the CPI, on a rolling annual basis, the portfolio met expectations for 62% of the time. Thus a 75% equity and 25% bond portfolio failed the return hurdle 38% of the time.
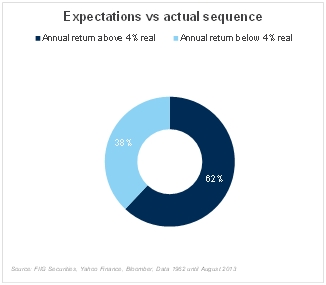 Figure 2
Now, if we were to reverse the return sequence, then we can determine whether this reversal of return sequence led to meeting the CPI + 4% return hurdle. As Figure 3 shows, the reverse sequence only met the return hurdle 28% of the time and failed a very significant 72% of the time. While we would expect that the return sequence and the inflation sequence might be causally linked, the correlation is insignificant, and so the reversal of the return sequence, against an unchanged inflation sequence remains a valid form of analysis. While the reverse sequence is a worse result, it remains apparent that both remain problematical and quite unsatisfactory, especially for older investors.
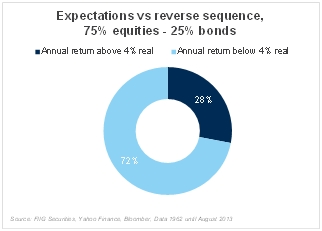 Figure 3
One wonders why an investor would endure all this portfolio volatility, when the solution to obtaining the return expectation of 4% over inflation is already available, via high credit quality inflation linked bonds. Obviously, the answer to this question is that investors need exposure to growth assets, especially when they are young and the investment time horizon is long. Yet, the question remains as to how much volatility investors should accept as their investment portfolio grows.
Part 3 - Ratio of contribution value to portfolio value
While we consider how the typical asset allocation of 75% equities and 25% bonds is both volatile, as described in Part 1, and how it generally fails to meet expectations of 4% over inflation, as described in Part 2, we will now look at how the market value of the portfolio tends to dwarf the total contributions, over time. Specifically, we look at the accumulation of a portfolio from the initial $100,000k investment, with $30,000 annual contributions, using a 75% equity and 25% bond allocation. Some examples may be instructive as follows:
- At the end of the first year which is 2 Jan 1964, the portfolio had a return of roughly 15.78%, which meant that the principal of $100,000, was valued at $115,783 ($100,000 times 15.78%), and the contribution that came at the start of the year was valued at $34,735 ($30,000 times 15.78%), so the total portfolio value was $150,518, which is 1.16 times the total contribution of $130,000 ($150,518 divided by $130,000 is 1.16), and
- At the end of the fourth year which is 3 Jan 1967, the portfolio had a return of roughly negative 7.0%, which meant that the prior value of $250,310 moves up to $260,764, due to the $30,000 contribution. Although the principal amount declined by roughly 7%, or a negative contribution of $17,435.77, the contribution of $30,000 increases the total value by $30,000, less 7%, or $2,089.70. Hence the total value is as follows:
- the prior value of $250,309.62
- less the accumulated market price fall of around 7%, or $17,435.77
- add the contribution of $30,000
- less the market price fall on the contribution of $2,089.71
- So the equation is $250,310 - $17,435.77 + $30,000 – 2089.70 =$260,784
At this point, total contributions were $220,000, so the ratio is now 1.19, or $260,784 divided by $220,000, and the total accumulation is shown in the Appendix to this article.
Now, this procedure of accumulation continues, as interest accrues and as asset values in the portfolio rise, all the way out to 2 January 2013, where the portfolio value is now roughly 21.38 times the total value of the all contributions.
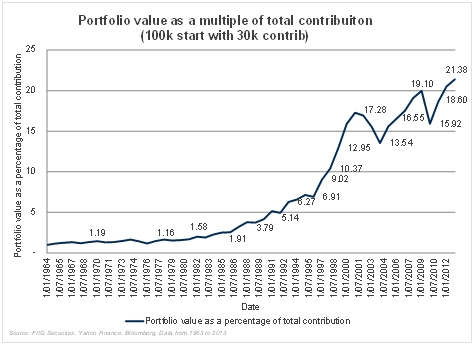 Figure 4
Furthermore, the critical point here is that as the portfolio grows, then the contribution becomes a small part of the total portfolio value, so the impact of a 25% movement in the portfolio, as a multiple of the total contribution value soars towards the end of the accumulation phase, as shown in Figure 5 below.
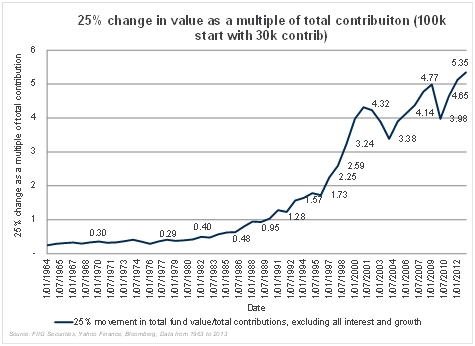 Figure 5
As Figure 5 shows, a 25% movement in the portfolio, at the end of the accumulation period, is over 5 times the total value of all contributions, using the 75% equities and 25% bond asset allocation. In other words, investors need to be increasingly careful, as the stakes get higher and higher as their portfolio grows. Volatility needs to decline as the portfolio grows so that investors do not risk a substantial decline in value just prior to retirement. An older investor will have limited scope to rebuild if they encounter a “shock” in their final accumulation years.
Conclusion
Portfolio volatility becomes increasingly risky towards the end of the investment period relative to total contributions and a negative 25% move in the value of the portfolio can be roughly 5 times the total contribution value. Incurring a large loss, just before retirement, therefore, can be devastating for older investors, since they can lose much more than they contributed.
Investors can control this risk by reducing the volatility of the portfolio over time, as age increases by gradually reducing equities and increasing bonds. Importantly, if you are 75 with 75% equities in your portfolio, then allocation is far too risky for your stage of life; the allocation to equities should be closer to 25% and bonds closer to 75%. As we have said before; “own your age in bonds”
Appendix: We can show the entire accumulation below in Table 1
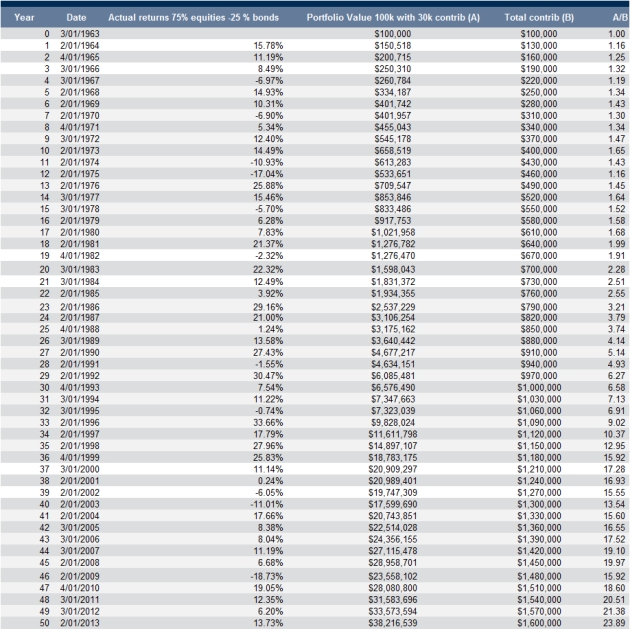 Table 1