Last week former CEO of the Commonwealth Bank, David Murray, reminded us of the pressures the Australian banking sector will face in coming years with bank earnings growth likely to remain under pressure. In a presentation to a risk management conference in Sydney he noted:
“What I haven’t seen before is the combination of low credit growth and a squeeze on margins. This could go on for some time. I don’t think there will be an improvement any time soon...”
With earnings growth under pressure, eventually, the dividend growth experienced in recent years will also come under pressure.
Last week, the International Monetary Fund’s ‘Financial System Stability Assessment’ report suggested the ‘Big 4’ needed to provide additional capital. If the recommendations are adopted by APRA, the ‘Big 4’ will need to allocate greater regulatory capital which will add further pressure to earnings as it leaves less funding to undertake ‘risk’ activities which will ultimately drive earnings growth.
The pressure on profit grows
There has been long term structural change in the Australian bank market going back to the 1990’s. Deregulation and the entry of non-bank lending saw a significant reduction in the Net Interest Margin (NIM) achieved by the Australian banking sector. Net interest margin is the difference between the rate at which the bank lends money out, and the rate it has to pay for funding, relative to its asset base. Competition suppressed the NIM in the lead up to the GFC, whilst post-GFC the cost of bank funding has acted to limit the NIM.
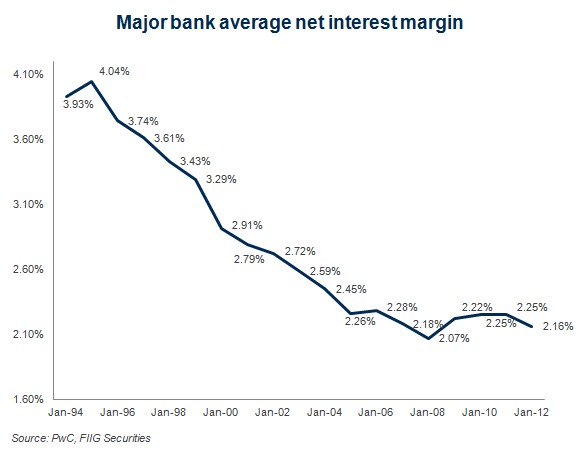
Figure 1
New Basel III regulations for banks and its emphasis on maintaining higher levels of capital/equity to protect the bank (and bondholders) will result in the NIM remaining under pressure for the medium to long term. It follows that earnings will also remain under pressure.
Key structural changes to the banking sector maintaining the pressure on NIM include:
- Increased overall cost of funding including offshore wholesale borrowing and retail deposits exceeding the re-pricing of the domestic loan portfolio (re-pricing will likely remain difficult in a competitive, low credit growth cycle)
- Continued intense competition in the retail deposit space – the RBA noted that they are seeking to encourage investors to chase returns by keeping rates low, so competition to maintain deposit levels may increase, further squeezing margins
- A requirement to increase holdings of highly liquid assets (HQLA) under the new regulatory framework. HQLA returns very little, so a higher requirement will likely negatively impact returns
- The upward blip in NIM post the GFC will gradually recede as high margin three year loans provided to refinance foreign bank debt loans (as they pulled out of the Australian market) rolls off.
The banks have sought to supplement the decrease in interest revenues by expanding into non NIM businesses – particularly funds management, superannuation and wealth management. However these remain highly competitive industries with many domestic and international players – the ‘Big 4’ will not be able to enjoy the same oligopoly returns they achieve under the 4 pillars policy in the wealth management market.
So, if earnings are going to remain under pressure from the top line, where will profit growth come from? One area is cutting costs, however the banks have already undergone some cost cutting, with head counts well down from the start of the GFC. In the last financial year costs were cut an average 2.4%.
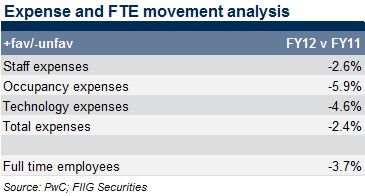
There remains scope for further cost cutting (though less so for some banks) however, eventually, the ability to cut costs will dissipate. Not all costs are avoidable or able to be cut.
Banking – the ‘New Normal’
The ‘New Normal’ in investment markets was a term popularised by Bill Gross and Mohamed El-Erian, Co-Chief Investment Officer’s of the world’s largest fund, PIMCO, to describe what investors should expect from markets in a post GFC world and is a concept which has continued to gain favour by many commentators and economists.
At its most basic level, the concept was put forward to counter the erroneous assertion that markets would simply revert to previous norms (returns, price-earnings ratios, growth rates) because that is simply what they do. Since El-Erian first raised the concept in 2010, more and more commentators have come to align themselves with ‘the new normal’ as the prospect of a ‘V-shaped’ recovery in the US evaporated and the realisation of a prolonged global downturn was on the cards as deleveraging occurred at the household, company and government levels.
The idea of the ‘New Normal’ suggests a more ‘Japanese-like’ prolonged period of very low growth (particularly in the US and Europe), which is likely to flow through to equity returns (as equities ultimately rise with growth). This slow growth in the US and Europe in turn flows through to the manufacturing countries (including China) as demand for consumer goods and construction inputs fall. There are a number of factors driving the prolonged period of low growth:
1. Deleveraging of household balance sheets – in the lead up to the GFC, households increased debt based on significant growth in house prices and easy access to credit. In most cases, the ‘equity’ earned in households through the rise in property values was put to work, either through investment assets, or in many cases depreciating assets.
For most families, the key driver of their feeling of economic well being lies in their largest investment, the family home. In the US, the property market remains sickly and whilst it appears to have bottomed out, negative equity remains common and persistent. Consumer confidence will likely remain subdued for some time to come. House prices remain depressed throughout much of Europe and unemployment rates remaining above 20% in many countries this is not the environment for a consumer based fight-back.
The idea that markets will return to the pre-GFC norms seems hard to justify when these norms were supported by highly leveraged household balance sheets. Households concerned about unemployment and the negative equity in their homes are not about to lead a market rally through debt funded consumption.
2. Deleveraging of company balance sheets – in the lead up to the GFC we witnessed the leveraging of corporate balance sheets. Just like leveraging in your investment portfolio, corporate leveraging super-charged returns, lifting RoE on the back of cheap debt funding. Post-GFC companies have been forced to deleverage, which has in turn lowered RoE.
Boards and management remain cautious, having just come through a debt crisis, they remain hesitant to borrow for expansion or acquisitions in a slow economy. In turn, corporate credit growth for the banks remains slow and without a significant improvement in general economic conditions it remains difficult to see the growth returning in the short term.
3. Deleveraging of government balance sheets – in response to the imminent collapse of their economies and banking systems as the GFC struck, governments sought to fill the gap by bailing out banks (overseas) and other major industries, undertaking massive stimulus programmes. This added debt to government balance sheets and gave us the GFC Part II – The Sovereign Crisis.
The majority of Western governments aren’t even producing a budget surplus, nor forecast in the near future, so their debt burden is still growing, despite radical austerity measures. The US currently runs a deficit of more than US$1trn. Growth in global economies will not be driven by governments any time soon. Even ‘good’ economies like Germany retain high levels of debt.
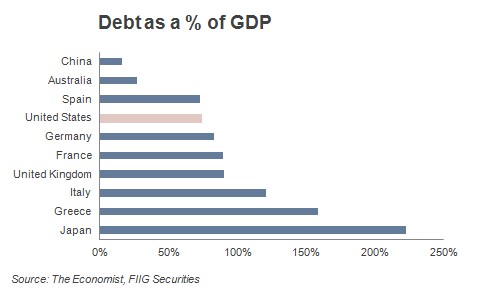
4. Low growth brings low returns – equity at its most basic level is a bet on growth. Share prices increase when a company grows. In the lead up to the GFC equities enjoyed a bull run to a large extent on the back of cheap debt funded growth. Companies were able to take on greater and greater levels of debt as banks relaxed lending, consumers consumed, comfortable in the knowledge that employment was strong and their house was worth more than it was last year, and governments stimulated their economies with tax cuts, social programmes and infrastructure spending creating ever widening deficits confident in the fact that there would always be someone there to buy their bonds to fill the gap.
When the GFC hit these drivers of growth dried up. Consumers remain cautious, the American consumer has gone missing, the European consumer is just worried about finding work, even in Australia, where the economy has fared relatively well, consumer spending remains subdued. Governments are introducing harsh austerity measures to the point of voter rioting, not because they want to, but because they have to.
The drivers of growth have dried up. Investors should re-set their expectations of returns from growth assets. This is Bill Gross’ ‘New Normal’.
Can dividend growth defy earnings growth?
The genesis of this article began when I was ‘playing’ with Bloomberg last week and noticed that (according to Bloomberg) NABs payout ratio was 101%. This means the bank paid out more than it earned last year, the last time this occurred (2009) the bank cut dividends. Westpac’s dividend ratio was also back close to its 2009 level.
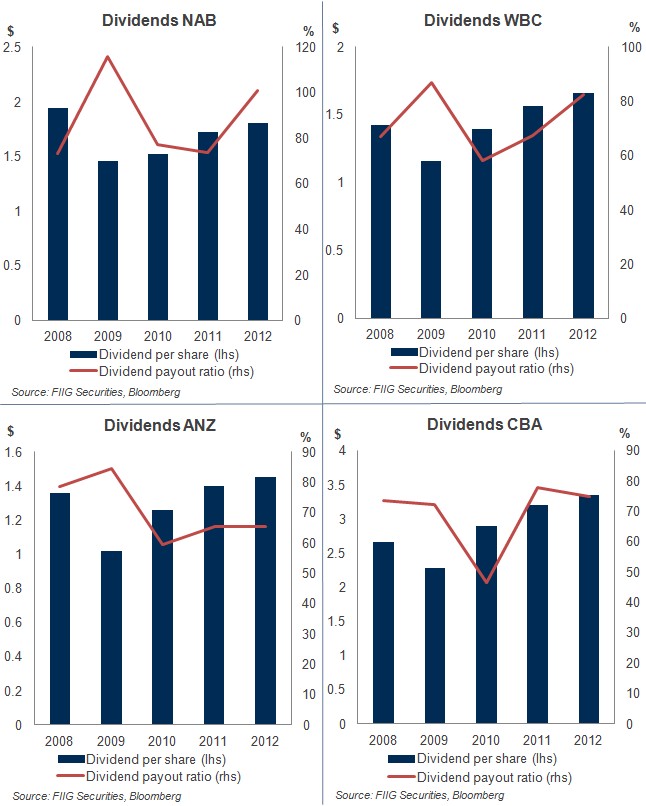
Bloomberg data can at times be misleading as it retains consistent ratio calculations across jurisdictions and industries which can cause distortions; however the ratios were high.
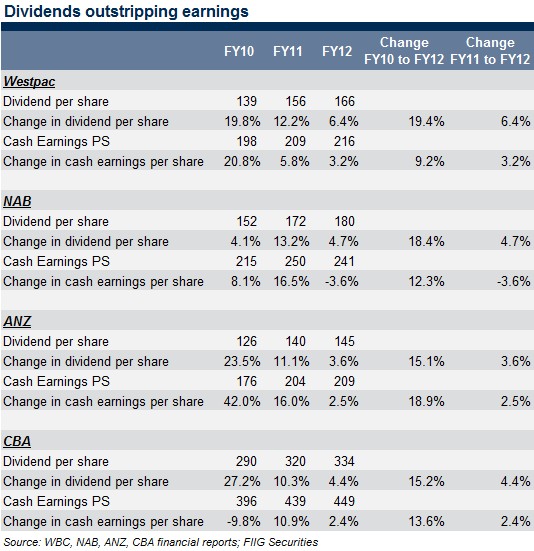
The banking industry in Australia prefers to calculate its dividend payout ratio based on cash earnings arguing this removes distortions from non-cash transactions (like hedging movements which will eventually reverse) – it is calculated as Dividends Per Share/Cash Earnings Per Share (1). The banks own calculations show that dividend growth has been outstripping earnings growth in recent years. Looking at the last three years’ dividends, three of the four ‘Big 4’ banks have increased their dividends at a rate greater than they have increased their underlying cash earnings. In the last year, all four increased dividends faster than they increased earnings. In the long, medium, and perhaps even short term, it is questionable as to whether this is sustainable.
Currently, the banks hold capital in excess of their stated internal targets. It can be argued that they may seek to return capital at some point in the future however they may be reluctant to do this given the general uncertainty in global and domestic markets. Deterioration in Australian loan markets is the likely driver impacting the possibility and extent of some form of capital management being undertaken. As this bad debt cycle progresses, non-performing loans would place pressure on earnings while risk weighted assets would also increase (which has a negative impact on the denominator of the capitalisation calculations). Both these factors impact capital and will be taken into consideration when banks asses any capital management activities. Any capital activity undertaken in the short term will not change the underlying dynamics placing earnings under pressure in the medium or long term.
Last week the International Monetary Fund (IMF), in its Financial System Stability Assessment, called for more capital to be held by the ‘Big 4’, not less. The ‘Big 4’ are rightfully identified as ‘domestic systematically important banks’ (D-SIBs) noting that the majors hold 80% of banking assets and 88% of residential mortgages (greater than any other major economy) making them perhaps the most systematically important domestic banks in any country of the world. The fact that the ‘Big 4’ are significant counterparties to each other further exasperates this risk.
The IMF also notes that due to their significant importance to the Australian economy, the ‘Big 4’ enjoy a funding price advantage as creditors, comfortable in the assumption that no major could be allowed to fail, assume authorities will pick up the tab. As a result, the IMF argues that the ‘Big 4’ should bear some of the cost of making the system safer. In this environment banks may be reluctant to undertake any capital management, even if they sit above internal targets, with the overhanging threat of increased capital requirements from the IMF hanging over their heads.
Reality check for the revert to mean
In its recent ‘Major bank analysis’, accounting firm PwC noted that going forward, the return on equity (RoE) in the bank sector is likely to revert to levels closer to ‘pre-boom’ levels, noting that in the build up to the GFC investors got used to high and unsustainable levels of return on equity. Pre-boom Australian banking RoE averaged 15%. In the lead up to the crisis, investors got used to RoE’s in the region of 20% as markets deregulated, investment bank arms were permitted to grow with limited thought of risk, bank balance sheets leveraged up, and housing and equity bubbles promoted growth in bank lending. Post-GFC PwC notes RoE in Australia has reverted to the pre-boom level of 15% with the firm noting a new equilibrium of 13-15% going forward. Given the Australian banks current sit at the top or above this range, the prospects of growth in RoE on this basis appear remote.
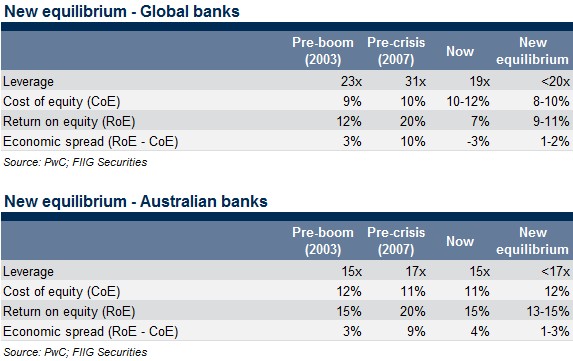
The structural changes in the sector, the increased competition and the increased requirement for regulatory capital is highlighted by the fact that while pre-tax profits of the major banks have doubled over the past decade, return on equity remains below the level achieved in 2003.
Bank shares as a fixed income substitute?
One line of thought we often hear is that owning the equities of the major banks can be used as a substitute for fixed income because the banks will not go bust (we hear it similarly applied to other high quality high yield companies like Telstra). To an extent, this is true, the Australian banks are well run and are unlikely to go under however this ignores one of the key qualities of fixed income – capital stability. The value of your capital in high quality fixed income investments will display far lower volatility when it comes to capital stability, even when compared to solid companies like Australia’s major banks.
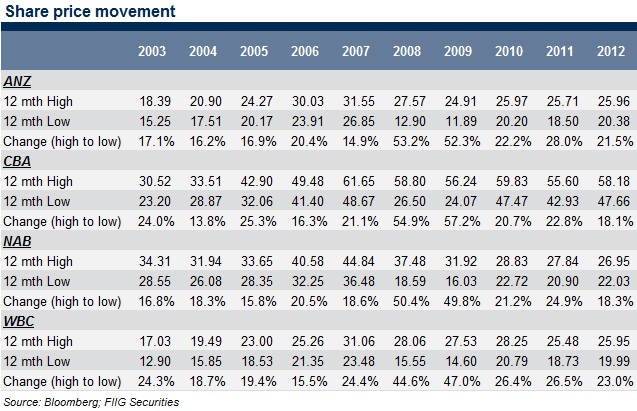
The table below shows the highs and lows of the share prices of the ‘Big 4’ banks over the last decade. At their worst, the capital value of the shares reported a 57.2% loss in any one year (CBA, 2009), however, even in the best year the drop from top to bottom was 13.8% (CBA, 2004). This is fine if you are able to pick the top and bottom of the market on a consistent basis, however is hardly providing capital stability for most investors who may, from time to time, need to access their capital (including when hitting retirement).
Whilst the data is somewhat simplistic in that it does not account for any capital/equity management which may have been undertaken over the period, the point remains valid that shares, even from high quality companies like our banks, do not provide a substitute for fixed income when it comes to preserving your capital.
But the value of shares will always go up for long term holders, right? Tell that to someone who bought NAB a decade ago.
Conclusion
First, it is worth noting that Australia’s banks (and our banking system in general) are some of the strongest in the world and we do not for a minute suggest that any of our major banks are of a concern from a credit perspective. However, investors looking to replicate the capital security and legal surety of fixed income from equities, may be disappointed.
Australian banks, like their global peers, are facing a tough operating environment with increased regulatory costs, increased capital requirements and a slow global economy. The ‘New Normal’ isn’t just a catch phrase, in a world where US debt continues to rise, European sovereigns remain in significant difficulty and the consumer has gone into hiding, credit growth will remain elusive. With slow growth and increased capital requirements, earnings will inevitably come under increasing pressure with boom-time returns on equity likely to be consigned to the past.
On its own, dividends outstripping earnings would be difficult to sustain, in an environment where earnings are facing significant headwinds, it may prove even more so.
(1) Bloomberg calculates dividend payout ratio as Cash Common Dividend/(Income before extraordinary items – minority interests – cash pref dividends)