In this article, we summarise 4Q12 results for Morgan Stanley, JPMorgan, Bank of America, Goldman Sachs and GE Capital. We conclude by highlighting securities available for these names.
Summary financial results


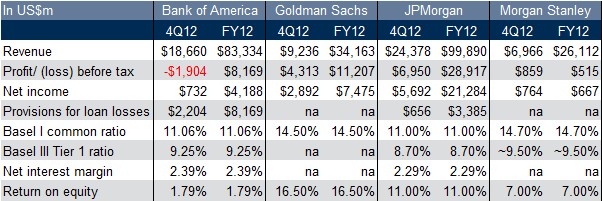
US banks results were a mixed bag with Goldman Sachs net earnings nearly trebling in 2012 and JP Morgan posting a record US$21.3bn in profits after a 53% surge in the final quarter. In contrast Morgan Stanley recorded a significant reduction in net income over the year and struggles with a return on equity which is less than half that of Goldman Sachs.
With the focus on regulation, banks continue to de-lever and reduce risk weighted assets in order to help meet Basel III requirements, as well as to adapt to business in a new financial environment. In broader trends, there also appears to be evidence that the US real estate market stabilised over the year.
Bank of America
Net income increased from US$392m to US$732m over the quarter. For the full year, 2012 net income was US$4.2bn, up US$2.7bn from 2011. By operating segment, Consumer, Global Banking, Global Markets and Global Wealth Management improved sequentially. The loss in Consumer Real Estate was wider. Compared to the prior quarter, revenue was lower, provisions were higher and expenses were up, but these were more than offset by an income tax benefit. In summary, another disappointing year for Bank of America with a very low return on equity of less than 2%.
Bank of America's earnings included various charges, primarily related to its recent settlement with Fannie Mae along with the regulatory foreclosure agreement. Most of the charges had been pre-announced earlier in January
Credit quality indicators improved as nonperformers and net charge-offs declined sequentially.
BoA's capital ratios declined over the quarter with the Tier 1 common ratio falling 35bps to 11.06%. However BoA’s estimated Basel III Tier 1 common capital ratio improved to 9.25% from 8.97% at 3Q12.
BoA noted that its global excess liquidity fell slightly to US$372bn, while the ‘time to required funding’ (the length of time they could last without approaching the market) remained strong at 33 months. BoA indicated that its ‘time to required funding’ would consistently remain above 24 months coverage even if liquidity balances declined somewhat on debt repayments going forward.
Goldman Sachs
Over the full year, net revenues increased 19% to US$34.16bn and net income increased 68% to US$7.48bn. Over the quarter net income increased 94% to US$2.8bn.
Investment banking fees rose 21% over the quarter driven by a 61% rise in equity underwriting and a 27% increase in debt underwriting. Investing and lending revenues were up slightly from US$1.8bn to US$2bn and asset management fees were stronger due to higher incentive fees (of US$344m compared US$82m in 3Q12).
Institutional Client Services revenue rose over the quarter however declined by 13% if excluding a US$500m investment gain and DVA revenues. Excluding the gain and DVA, FICC declined 14% and equities were down 12%. Assets under management were flattish. The compensation/revenue ratio was 37.9% for FY12 compared 42.4% FY11 reflecting higher revenue and cost saving initiatives. 4Q12 results included US$260m of reserves for litigation and regulatory proceedings, US$157m of charitable contributions and US$126m DVA hit.
The firm’s Tier 1 capital ratio was 16.7% and the Tier 1 common ratio was 14.5% up from 15.0% and 13.1% respectively compared the end of 3Q12. ‘Global core excess liquidity’ was US$175bn averaging US$173bn for the fourth quarter compared with an average of US$175bn for the third quarter of 2012.
JPMorgan
Net income fell slightly by US$16m to US$5.7bn over the quarter. Looking at business segments, trends were mixed. Asset Management and Corporate/Treasury were higher, while Consumer and Community Banking declined. Corporate & Investment Banking and Commercial Banking were flattish.
Investment bank fees rose 20% over the quarter, debt underwriting rose 23%, advisory was up 20% and equity underwriting was up 13%. FICC trading declined 15% and underlying equity trading was down 12%. Also included in the results were a US$900m cost relating to a mortgage servicing settlement, US$567m of DVA and US$184m of litigation in corporate/other. Gains included a US$620m tax credit, US$972m loan loss reserve release and US$102m from securities gains.
JPMorgan's earnings were accompanied by the release of various documents related to the large Chief Investment Office trading loss in 2012. The documents included a 100+ page ‘Task Force’ report. Some of the main findings include that the CIO was not forthcoming in the risks it was taking, while at the same time, the oversight and risk management functions were not focused on the potential build-up of risk within the CIO investment portfolio. At one point in the Review Committee's report, it notes that ‘risks posed by the positions in the synthetic credit portfolio were not elevated to the Risk Policy Committee as they should have been, or to the Board’, thereby depriving both parties of the opportunity to directly address them. It seems there was a lapse in managerial attention to the CIO, especially in light of the size of the investment portfolio overseen by the office.
Credit quality metrics improved in 4Q12 as nonperforming assets and net charge-offs were lower sequentially.
Tier 1 common ratio rose to 11%, while the estimated Basel III Tier 1 common ratio reached 8.7%. The CEO stated that the company expected to reach a 9.5% Basel III Tier 1 common ratio by late 2013, as well as be ‘fully compliant’ with the liquidity coverage ratio measures.
Morgan Stanley
Excluding the impact of debt valuation adjustments (DVA), earnings from continuing operations improved to US$867m, compared with US$534m in 3Q12 and a loss of US$374m in 4Q11. Results were driven by improvements in Global Wealth Management, Institutional Securities, and Asset Management. During FY2012, core earnings of US$3.1bn nearly doubled from the prior year.
Investment banking fees rose 26% over the quarter, with all categories up. Excluding DVA, equity trading rose 3%. Commissions, asset management fees all rose over the quarter. The pre-tax margin in wealth management was 17% in 4Q12, driven by broad based revenue growth and lower expenses.
MS increased its cost savings expectations from US$1.4bn to US$1.6bn over the next two years and pointed to 2014 expenses potentially declining to US$24b compared US$25.6bn in 2012. These savings reflect recently announced headcount reductions and other actions.
Morgan Stanley unveiled another six-point strategic plan aimed at improving shareholder returns: 1) the acquisition of the remainder of Morgan Stanley Smith Barney, 2) achieving Global Wealth Management profitability goals through expense controls, 3) reducing risk weighted assets in Fixed Income and Currency, 4) to continuously drive down expenses, 5) to drive growth through cross-selling and 6) to generate returns in excess of the cost of capital.
Morgan Stanley's Tier 1 ratio increased 100bps to 17.9% and the Tier 1 Common ratio 80bps to 14.7%. On a Basel III basis the Tier 1 common ratio increased to ~9.5%, the highest amongst big banks and brokers.
GE Capital
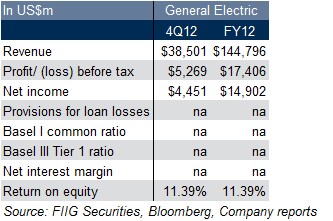
GE Capital progressed with its strategy of a smaller, more focused financial services business with solid earnings. GE Capital’s earnings grew 9% over the quarter with net income of US$419bn. Commercial Real Estate grew net income to US$0.8bn while shrinking assets by US$15bn. GE Capital paid a US$1.0bn dividend to the parent in the quarter, bringing the year-to-date total to US$6.4bn. GE Capital’s Tier 1 common ratio remains strong at 10.2%.
In relation to results at the parent level (General Electric) results were strong with industrial organic growth of 4%, or 8% for the year. Industrial margins expanded 120bps and industrial orders were up 7% over the quarter. Infrastructure orders were up 2%. Book to bill of 1.2x was much better than last quarter’s 0.91x (a ratio above 1 implies that more orders were received than filled, indicating strong demand). Order pricing was up 0.5% compared 0.1% last quarter. Interest and other charges dragged on results by nearly US$400m as did Discontinued Operations (Japanese financial/consumer businesses and WMC Finance) which was a positive contributor the previous quarter.
Both GE Capital and its parent recorded solid results, especially impressive given difficult condition across the financial and industrial sectors.
Securities
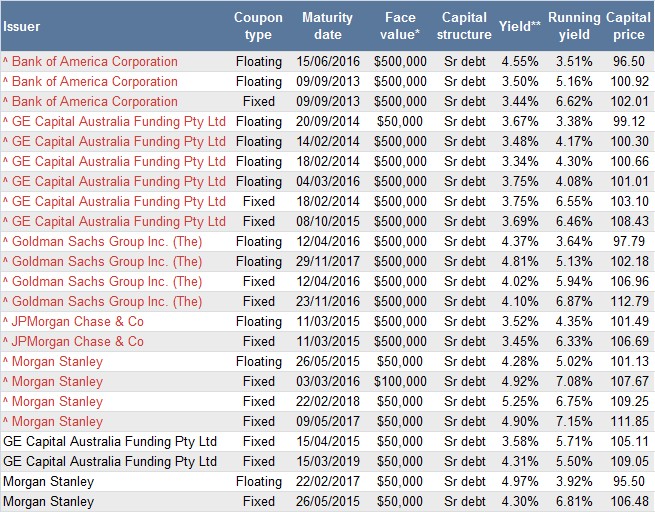
While global financial bonds have generally rallied in recent times and may present already invested clients an opportunity to take some profits, the credit quality remains sound for the names covered here and may provide good diversification opportunities. Figure 1 details AUD securities available for the above companies with some offering attractive yields and running yields.

Figure 1
* Current face value on inflation linked bonds represents the inflation adjusted face value.
** Yield for floating rate notes is the swap rate to maturity/call plus the trading margin.
^ Must be a wholesale client to purchase these bonds.
All prices and yields are a guide only and subject to market availability. FIIG does not make a market in these securities.