by
William Arnold | Aug 06, 2013
The majority of US banks beat consensus for the 2Q13 earnings season. Loan growth is still absent and as expected most banks reported lower net interest margins highlighting interest rate risk as an emerging story given the possibility for higher interest rates going forward. Reserve releases provided earnings increases, however this will begin to wane
Regulation is the main story for US banks. In general terms regulators suggest that banks have not made enough progress in rationalising their corporate structures or in paring back their volatile trading activities. Big US banks may have to continue reducing their span and scope in order to satisfy legislation and regulation. This may be in the form of dramatically shrinking their balance sheets and/or smaller divestments or spin-offs. It is however too early to forecast potential outcomes given the level of uncertainty surrounding many of these initiatives.
JPMorgan
JPM reported earnings of $6.5bn down $30m from record results q/q. Most core business segments posted sequential earnings improvements. Corporate & Investment Banking, Commercial Banking, Consumer & Community Banking and Asset Management were higher, while the Corporate/Treasury segment swung to a loss.
Capital markets saw strong revenues across the board. FICC trading rose 17% y/y (-14% q/q), Equities trading was up 24% (-3% q/q) and investment banking fees +38% y/y (+20% q/q). Chief Executive Jamie Dimon said that higher interest rates could lead to a “dramatic reduction” in profits from mortgages. Net interest income (2.2% vs 2.37% previous) was weaker reflecting flattish loans and lower securities. The net interest margin (NIM) declined a large 17bps q/q, which appears to be entirely driven by higher cash balances.
Credit quality metrics improved q/q as non performing assets and net charge-offs declined. The company indicated that it expects credit quality to continue to improve, driving further reserve releases into the next several quarters. Non-performing assets declined to $10.9bn, down 6%, as nonperforming loans were lower at $9.7bn, down 7%.
JPM noted the Holding Co Basel III Tier 1 capital leverage ratio was 4.7% at June 30 versus a required 5% (by 2018). JPM pointed to capital generation totalling 80bps in the next six quarters and up to another 100bps from optimising capital/balance sheet. The Basel III core Tier 1 was 9.3% (+40bps q/q) just 20bps below its expected requirement.
Citigroup
Results were positive overall, supported by capital markets, cost control and stronger capital. FICC’s revenue rose 18% y/y, while investment banking fee revenue were up by 1%. Equity trading revenues were up 68%, off a low base but also +14% q/q. Group expenses were well contained, declining 1% q/q with staff down 2%. Citi Holdings (the non-core arm) assets declined 12% q/q given the sale of the remaining brokerage joint venture and a 7% reduction in loans. The net interest margin declined 3bps to 285bps. This decline was driven by lower loan and investment yields, partially offset by an improvement in funding costs.
Citi highlighted that its capital ratios improved in 2Q13 estimating a 10% core Tier 1 ratio. Citi disclosed that its supplementary leverage ratio was approximately 4.9% as of 2Q13, so it would have to build this ratio slightly going forward in order to be compliant with the new 5% holding company. Citi stated that it was "close to" the 6% bank level requirement, although it did not disclose a specific ratio for the bank level.
Morgan Stanley
MS posted solid results in its investment banking business (fees rose 14% q/q and 22% y/y), in particular in advisory and equity underwriting. While the advisory business is smaller than Goldman Sachs', it topped all other peers and booked market share gains. Equity underwriting was mostly in-line with its peers and benefited from the broad increase in IPOs and renewed interest in equities. Debt underwriting improved sequentially but was impacted by the market disruption in June. In sales and trading, equities continues to be an area of strength for Morgan Stanley and benefited from inflows into the asset class (up 13% q/q and 58% y/y).
The wealth management business completed the Morgan Stanley Smith Barney (MSSB) transaction on the last day of the quarter and as a result the benefits of full ownership of MSSB were not reflected in the 2Q13 results.
MS received regulatory approval to repurchase up to $500m of its common stock, its first since the credit crisis. This can be seen as another significant step in MS’s return to health.
MS’s holding leverage ratio was 4.2%, below the proposed 5% minimum, but its bank subsidiary was above the 6% minimum. The firm forecasts both bank holding and bank subsidiary will be above the proposed requirements by 2015. The firm’s Basel III core Tier 1 ratio increased 10bps q/q to 9.9%.
Bank of America
BoA reported solid results with a stable net interest margin, lower provisions as credit quality improved and lower expenses. Earnings of $3.5bn rose substantially from $1.1bn (+222%) in the prior quarter. By operating segment, Wealth Management (+5%) and Global Banking (+1%) were higher sequentially, while Consumer Banking (-3%) and Global Markets (-18%) declined. Consumer Real Estate Services (legacy real estate) loss narrowed to $937m from $2.2bn.
BoA reported an estimated Basel III core Tier 1 ratio of 9.6% (up 8bps q/q). This is approximately 110bp above its expected requirement, which includes a minimum plus capital conservation buffer of 7% and a Global Systemically Important Banks (G-SIB) buffer of 1.5%. BoA’s capital management efforts could therefore focus more on shareholders in future.
The estimated holding Co supplementary leverage ratio stood at 4.9%, just about its 5% requirement and its bank-level supplementary leverage was over the 6% requirement.
Goldman Sachs
Earnings were $1.9bn, down 15% q/q and up 101% y/y. Most of the y/y increase came from better than expected Investing and Lending gains ($1.4bn) and a lower tax rate. Investment Banking fees were flat compared a strong 1Q13 and up 29% y/y. The y/y increase was driven by a 55% rise in debt underwriting and a 40% increase in equity underwriting. FICC declined 25% q/q and rose 11% y/y. Equities trading revenues were flat q/q and up 21% y/y.
GS declined to provide an estimate of its leverage ratio but said that it is “very comfortable” with its ability to meet regulatory hurdles. Basel I Tier 1 rose to 15.6% (+120bps) and its estimated Basel III core Tier I ratio was roughly 9.3%.
Relative Value

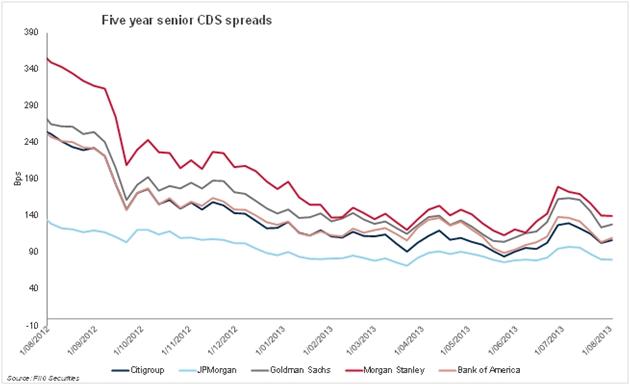
The above CDS chart shows the more capital markets oriented banks (MS/GS) trade with wider spreads when compared to more traditional banking focused organisations (Citi) mainly given the inherently higher risk and volatility of such businesses. However with the concerns about the direction of interest rates over the medium/longer term we prefer broker/dealers GS and MS as well as JPM as they are exposed to less interest rate risk.

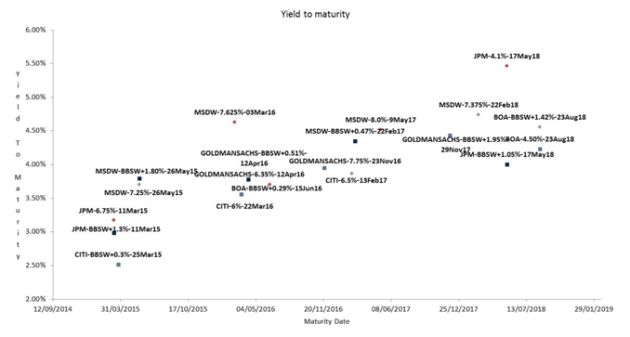
The above chart shows the yield to maturity for senior US bank bonds in AUD. Not only do we more prefer broker/dealers, they are also offering good relative value. MS (MSDW), JPM and GS all offer pick up over their peers across maturities.
All prices and yields are a guide only and subject to market availability. FIIG does not make a market in these securities.