by
William Arnold | Dec 02, 2014
This article analyses the differences in pension asset allocations around the world. Australians are drawn to, and over exposed to, shares, which are the highest risk assets. This article discusses the differences between Australian allocations and other OECD countries and how this information can be used when assessing your own portfolio allocation.
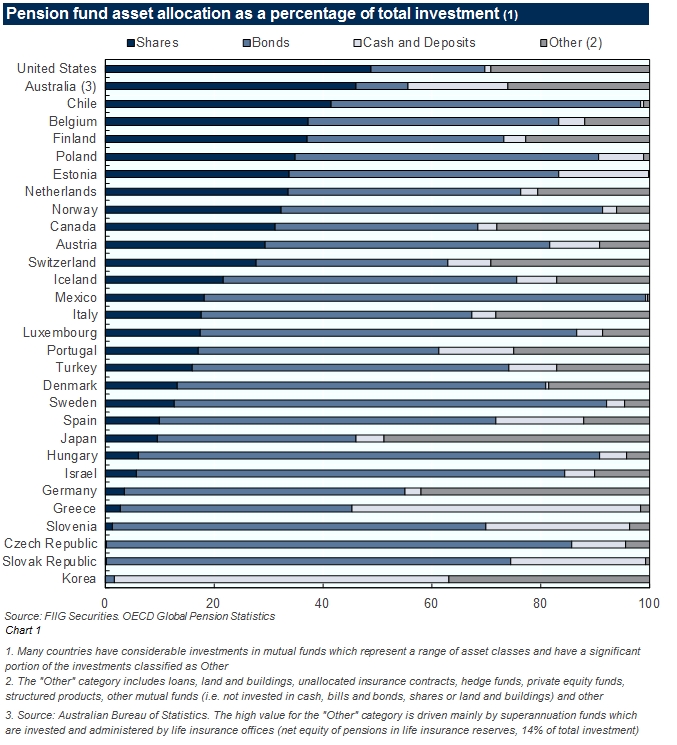
Chart 1 below shows the pension fund asset allocation in 2013 for 29 OECD countries across four asset classes: shares, bonds (inclusive of short term “bills” (less than one year) and long term “bonds” (over one year”), cash and deposits and other.

Key findings include:
- The average asset allocation to bonds was 52%, to shares 21%, to cash and deposits 11% and 16% to “other”.
- The exposure to bonds varies from less than 10% in Australia to more than 65% in Denmark.
- The exposure to shares also varies considerably, ranging from less than 10% in Korea and Japan to 46% in Australia.
- The allocation to cash and deposits varies considerably, ranging from almost zero in several countries to 18% in Australia.
Australian superannuation
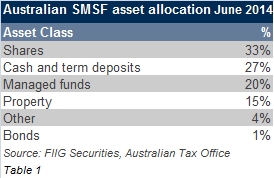
Self-Managed Super Funds (SMSFs) are uniquely Australian and allow the individual to bear the full responsibility for management of their funds. SMSFs represent about one third of all superannuation assets. Table 1 shows the asset allocation of these funds as at June 2014, as reported by the Australian Taxation Office.

Australian pension funds have a 9% allocation to bonds (which is by far the lowest of all OECD countries) but SMSFs have even less at just 1%, showing how under-allocated they are to this asset class (although this allocation is likely to be slightly higher by virtue of bond allocations in managed funds). SMSFs also appear to have a higher allocation to cash and term deposits than the OECD pension funds. One of the reasons for this outcome is likely to be that these members are older and possibly in the pension drawdown phase, as well as there being a lack of access to broader fixed income investments in Australia with cash and term deposits often used as a proxy for low risk, defensive asset allocations.
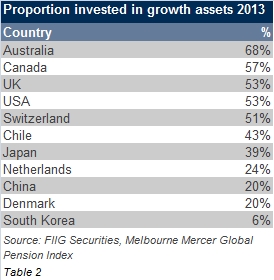
Also of note is the Melbourne Mercer Global Pension Index which uses a measure that estimates the proportion of pension assets invested in “growth” assets as opposed “defensive” assets (see table 2 below). Growth investments are made with the objective of achieving a return including capital growth and income above the inflation rate. The actual returns are related to economic performance and therefore can be more volatile. Growth assets include: shares, property and alternative assets. Defensive assets are investments made with the objective of achieving more stable returns and include cash and fixed income (i.e. bonds).

As suggested by the data, Australia has the highest proportion invested in growth assets with 68%. Most other countries have between 40% and 60%. The obvious question to ask is whether this relatively high exposure to more volatile growth assets places an unreasonable risk on the provision of adequate and sustainable retirement incomes for Australians over the long term.
Factors affecting asset allocation in Australia
Some of the factors that may drive pension allocation to growth vs defensive assets are:
- Some countries have a significant level of defined benefit or guaranteed pensions or annuities in payment, which mean the superannuation fund guarantees a certain lump sum or cashflow in retirement. The super fund takes the risk and thus chooses to invest in lower risk, more certain investments that enable it to match assets to liabilities. The most suitable assets for matching liabilities are bonds and other fixed income investments. By contrast, Australia has a very small number of defined benefit funds, most are “defined contribution”, where the investor takes all of the risk.
- The relative importance of defined benefit schemes has reduced steadily in Australia over recent years so that the assets attributed now represent less than 11% (Annual Superannuation Bulletin, APRA, 2014). These features mean that the pressures to match assets with pension liabilities or to de-risk is largely absent from Australia.
- The maturity of the pension system affects the profile of the current liabilities. Superannuation and pension systems take decades to mature so that a younger system will have very few pensions in payment and therefore require less bonds and fixed income to support such payments. By contrast, a mature system will have a much higher proportion of the liabilities for older members and therefore a need for less volatile investments. The Australian Superannuation Guarantee system commenced in 1992 and the mandatory contribution rate only reached 9% in 2002. This means that most of the liabilities and the associated assets relate to active employees. However this is starting to change, as baby boomers begin to retire. The Australian SMSF statistics, as detailed in Table 1 above, are more representative of those in or nearing retirement and clearly demonstrate a very small allocation to bonds.
- It is inevitable that most markets have a home bias in respect of their investments. An example of this outcome can be seen in the UK where major pension funds have a strong investment in index-linked government bonds due to their availability. By contrast, both the Australian index-linked and corporate bond markets are relatively small, thereby limiting the opportunity to invest in domestic fixed income.
- There is also limited understanding and access to fixed income investments, with minimum investment amounts of $500,000 per bond for much of the Australian bond market still prevalent as recently as 2010. Practically every other OECD jurisdiction has smaller denomination amounts and a general awareness and acceptance of the importance of bonds in an overall investment portfolio.
- Unlike many OECD countries, the Australian high yield/non-investment grade market is in its infancy and this is typically where SMSF investors are attracted.
- The dividend imputation system increases the relative attractiveness of Australian shares to bonds. A related outcome is for investors who are seeking regular income (i.e. not capital gains). They may perceive the dividends from, for example, the four major Australian banks to be a good option, regardless of the potential for volatility and the fact that dividends can be cut or even eliminated.
What is an appropriate asset allocation based on your risk profile?
Investors typically differ in their preference for risk and return depending on their age and risk sensitivity. Generally the older and closer to retirement an investor is, the greater need for income and capital stability, and as a consequence, asset allocations should favour cash and bonds over shares.
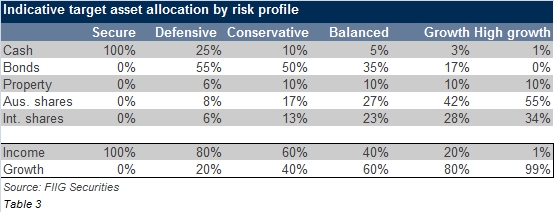
Portfolios should be constructed or optimised to achieve the highest expected returns for given levels of overall portfolio risk depending on your circumstances. A typical example of such a range in asset allocations is provided below in table 3 and is indicative only.

Note how exposure to riskier “growth” assets such as shares increases as allowable portfolio risk increases (typically before retirement with long term investment horizons) while exposure to defensive securities increases as risk tolerance decreases and more emphasis is placed on generating income and protecting capital.
Conclusion
There is not a single asset allocation for pension/superannuation funds that is right for all members but an old rule of thumb to ‘own your age in defensive assets’ is a good starting point. Diversification of assets should represent a fundamental feature of all investment strategies. Australian superannuation funds have a very high exposure to shares and other growth assets when compared to many other countries. As the superannuation system matures and there is a shift in funds towards retirees, and the benefits of bonds in a portfolio setting become more understood, it is likely that this exposure will gradually reduce in favour of defensive assets.
The current overall allocation, which provides a high level of exposure to volatile assets, will become less appropriate as the baby boomers retire and begin to draw down their funds. A broader range of assets, including corporate bonds and credit, is likely to provide a better long-term outcome for these investors.
Copyright The contents of this document are copyright. Other than under the Copyright Act 1968 (Cth), no part of it may be reproduced or distributed to a third party without FIIG’s prior written permission other than to the recipient’s accountants, tax advisors and lawyers for the purpose of the recipient obtaining advice prior to making any investment decision. FIIG asserts all of its intellectual property rights in relation to this document and reserves its rights to prosecute for breaches of those rights.
Disclaimer Certain statements contained in the information may be statements of future expectations and other forward-looking statements. These statements involve subjective judgement and analysis and may be based on third party sources and are subject to significant known and unknown uncertainties, risks and contingencies outside the control of the company which may cause actual results to vary materially from those expressed or implied by these forward looking statements. Forward-looking statements contained in the information regarding past trends or activities should not be taken as a representation that such trends or activities will continue in the future. You should not place undue reliance on forward-looking statements, which speak only as of the date of this report. Opinions expressed are present opinions only and are subject to change without further notice.
No representation or warranty is given as to the accuracy or completeness of the information contained herein. There is no obligation to update, modify or amend the information or to otherwise notify the recipient if information, opinion, projection, forward-looking statement, forecast or estimate set forth herein, changes or subsequently becomes inaccurate.
FIIG shall not have any liability, contingent or otherwise, to any user of the information or to third parties, or any responsibility whatsoever, for the correctness, quality, accuracy, timeliness, pricing, reliability, performance or completeness of the information. In no event will FIIG be liable for any special, indirect, incidental or consequential damages which may be incurred or experienced on account of the user using information even if it has been advised of the possibility of such damages.
FIIG provides general financial product advice only. As a result, this document, and any information or advice, has been provided by FIIG without taking account of your objectives, financial situation and needs. Because of this, you should, before acting on any advice from FIIG, consider the appropriateness of the advice, having regard to your objectives, financial situation and needs. If this document, or any advice, relates to the acquisition, or possible acquisition, of a particular financial product, you should obtain a product disclosure statement relating to the product and consider the statement before making any decision about whether to acquire the product. Neither FIIG, nor any of its directors, authorised representatives, employees, or agents, makes any representation or warranty as to the reliability, accuracy, or completeness, of this document or any advice. Nor do they accept any liability or responsibility arising in any way (including negligence) for errors in, or omissions from, this document or advice. Any reference to credit ratings of companies, entities or financial products must only be relied upon by a ‘wholesale client’ as that term is defined in section 761G of the Corporations Act 2001 (Cth). FIIG strongly recommends that you seek independent accounting, financial, taxation, and legal advice, tailored to your specific objectives, financial situation or needs, prior to making any investment decision. FIIG does not make a market in the securities or products that may be referred to in this document. A copy of FIIG’s current Financial Services Guide is available at www.fiig.com.au/fsg.
An investment in notes or corporate bonds should not be compared to a bank deposit. Notes and corporate bonds have a greater risk of loss of some or all of an investor’s capital when compared to bank deposits. Past performance of any product described on any communication from FIIG is not a reliable indication of future performance. Forecasts contained in this document are predictive in character and based on assumptions such as a 2.5% p.a. assumed rate of inflation, foreign exchange rates or forward interest rate curves generally available at the time and no reliance should be placed on the accuracy of any forecast information. The actual results may differ substantially from the forecasts and are subject to change without further notice. FIIG is not licensed to provide foreign exchange hedging or deal in foreign exchange contracts services. The information in this document is strictly confidential. If you are not the intended recipient of the information contained in this document, you may not disclose or use the information in any way. No liability is accepted for any unauthorised use of the information contained in this document. FIIG is the owner of the copyright material in this document unless otherwise specified.
The FIIG research analyst certifies that any views expressed in this document accurately reflect their views about the companies and financial products referred to in this document and that their remuneration is not directly or indirectly related to the views of the research analyst. This document is not available for distribution outside Australia and New Zealand and may not be passed on to any third party without the prior written consent of FIIG. FIIG, its directors and employees and related parties may have an interest in the company and any securities issued by the company and earn fees or revenue in relation to dealing in those securities.