by
Justin McCarthy | Feb 03, 2015
Key points:
- The top performing bonds in 2014 were all long dated fixed rate or inflation linked bonds due to a huge reduction in long term yields.
- The ten year swap rate fell almost 1.5% in 2014, a massive move particularly considering yields were already low by historical standards. Following yesterday’s rate cut the ten year swap has fallen 51bps this year alone and is 2.0% below the level at 1 January 2014.
- The top performing bond in 2014 was the Queensland Treasury Corporation 6.5% fixed rate bond with a maturity date of 14 March 2033, returning a whopping 28.2% (and the price has risen a further 6% since the start of 2015).
- By comparison the best performing floating rate note was Royal Bank of Scotland (RBS) February 2017s which had a total return of 9.03%.
Following the end of the 2014 calendar year, we calculated the holding period returns for all of the bonds we trade, to find the top performing bonds for the year. The holding period return is determined by adding the annual interest income received to the capital gain or loss on each bond for the year.
It was the size of the capital gain which largely determined which were the best performing bonds. The large capital gains were concentrated among long dated fixed rate and inflation linked bonds because they tend to rise in value when yields, and especially long term yields, fall as they did in 2014.
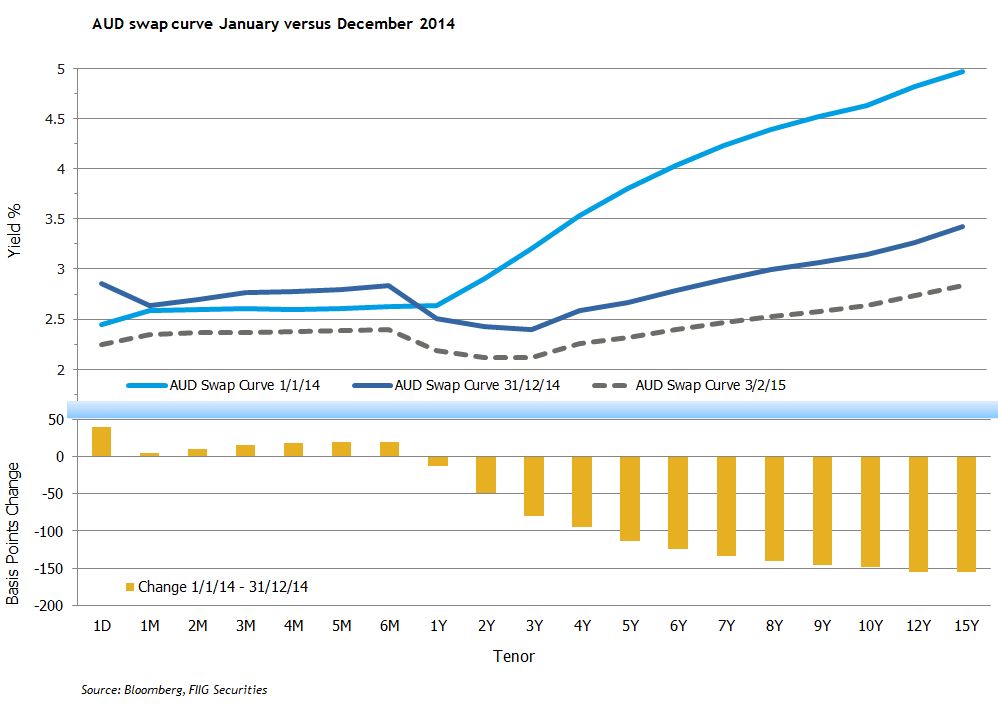
The chart below plots the AUD swap curve on 1 January 2014 (in light blue) and again as at 31 December 2014 (in dark blue). We also show the current swap curve (dotted grey line) following yesterday’s rate cut.
The swap curve is used as a proxy for the market’s prediction of future interest rates (or yields). The yellow bars at the bottom of the chart are the difference between the January 2014 and December 2014 swap curves at various maturity points. For example, the ten year swap rate fell just shy of 1.5% from 4.633% at the beginning of January 2014 to 3.148% by the end of the year. It has since fallen a further 51bps in just over a month to 2.638%, the lowest on record. This is a massive move, particularly when interest rates were already at low levels.
It is clear that the market significantly reduced its expectation of future interest rates in 2014 and this trend has only intensified in 2015.

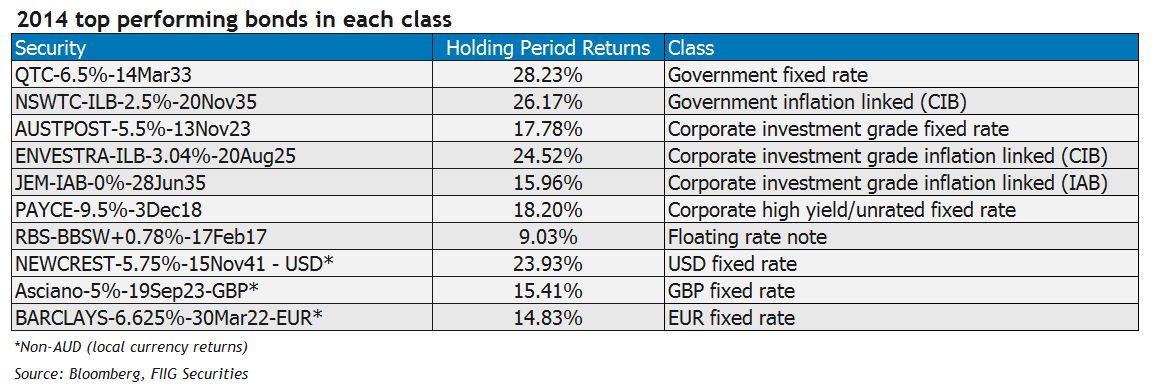
As the table for top performing bonds is dominated by numerous long-dated government bonds, all with very similar characteristics, we have taken a slightly different approach below and highlighted the top performing bonds in each class:
- Government fixed rate bond – Queensland Treasury Corporation 6.5% (14 March 2033 maturity) returned a whopping 28.2% for the year due to it being one of the longest dated fixed rate government bonds in the market. With yields in the 15 year part of the swap curve falling in excess of 1.5% over 2014 (as shown in the chart above) this bond performed particularly well given the high ‘duration’ or sensitivity to interest rate movements. While there were a number of other long dated government bonds from both the Commonwealth and state governments that returned over 20%, the QTC 33s topped the table for 2014 (and the price has risen a further 6% since the start of 2015 as yields continue to fall to new lows).
- Government inflation linked bond (ILB) – NSW 2.5% capital indexed bond (CIB) (20 November 2035) returned 26.2% over the year. While this is an ILB it also pays a fixed rate of return of 2.5% per year on an accreting capital base that increases by inflation each quarter. As such it is also very sensitive to interest rate movements and expectations. The very long maturity date and strong performance of the ILB sector over the past year saw this bond top its class.
- Corporate investment grade fixed rate bond – Australia Post 5.5% (13 November 2023) returned 17.8% being a high quality and long dated fixed rate bond.
- Corporate investment grade ILB – Envestra 3.04% CIB (20 August 2025) returned 24.5% as it benefitted from both the fall in yields but also a reduction in credit spread with the underlying credit rating of Envestra being upgraded in the latter part of the year. The Sydney Airport 3.12% CIB (20 November 2030) was only slightly behind with a holding period return of 22.9% for the year. In the indexed annuity bond (IAB) sector, the top performer was the JEM Southbank IAB (28 June 2035) with a total return of 16.0%.
- Corporate high yield/unrated – PAYCE Consolidated 9.5% fixed rate bond (3 December 2018 maturity date, callable 3 December 2016) returned a very healthy 18.2% for the year. While being a fixed rate bond helped the returns, much of the performance can be accounted for in the high 9.5% annual coupon (a factor that is particularly important in low interest rate environments such as currently exists). However, a significant reduction in credit spread was also a large contributor to the performance. The risk to the bond reduced significantly when the East Village project finished and the guarantee from the shopping and commercial centre assets was provided. A number of other FIIG originated deals also returned over 10% in 2014 as the combination of high outright coupons, lower credit spreads and lower yields saw fixed rate high yield bonds outperform.
- Floating rate note - by comparison to the 28.2% return on the QTC 33s, the best performing floating rate note was the RBS February 2017s which had a total return of just 9.03% highlighting the outperformance of fixed rate bonds in a falling (and already low) interest rate environment.
- USD bonds – a similar trend was seen in global markets with yield curves falling. Of the USD bonds we track, the best performing was the very long dated Newcrest 5.75% fixed rate bond (15 November 2041) which increased 23.9% in USD terms and would be up over 30% if the depreciation of the AUD is taken into account. In the more commonly traded bonds, the Telstra 4.8% fixed rate bond (12October 2021) was a standout with a 20.3% return in USD and almost 30% if currency impacts are included.
- EUR and GBP – of the bonds we track, the top performers were the Barclays 6.625% fixed rate (30 March 2022) EUR bond which returned 14.8% and the Asciano 5.0% fixed rate (19 September 2023) GBP bond with a 15.4% annual holding period return.

With AUD swap and yield curves falling further since the start of January 2015 (to new historic lows), the outperformance of long dated fixed rate and inflation linked bonds has extended. Many of the AUD bonds listed above would have one year holding period returns of over 30% if assessed on the period 3 February 2014 to 3 February 2015, particularly given the large fall in yields following the RBA rate cut yesterday.
It is clear that interest rates are a very important determinant of returns.
All prices and yields are a guide only and subject to market availability. FIIG does not make a market in these securities.
For more information, please call your local dealer on 1800 01 01 81.
Definitions
Duration (Macaulay duration)
Is a useful measure of risk in bond investment. Developed in 1938 by Fredric Macaulay, this type of duration measures the number of years needed to recover the cost of the bond, taking into account the present value of all coupon payments and the principal payment received in the future (see Section 2.6 Duration). Bonds with higher duration typically carry more risk and thus have higher price volatility. For zero coupon bonds, duration equals the time to maturity, for vanilla fixed rate bonds, duration is always less than time to maturity, for floating rate notes, duration is typically very low and based on the next coupon reset date.
Swap
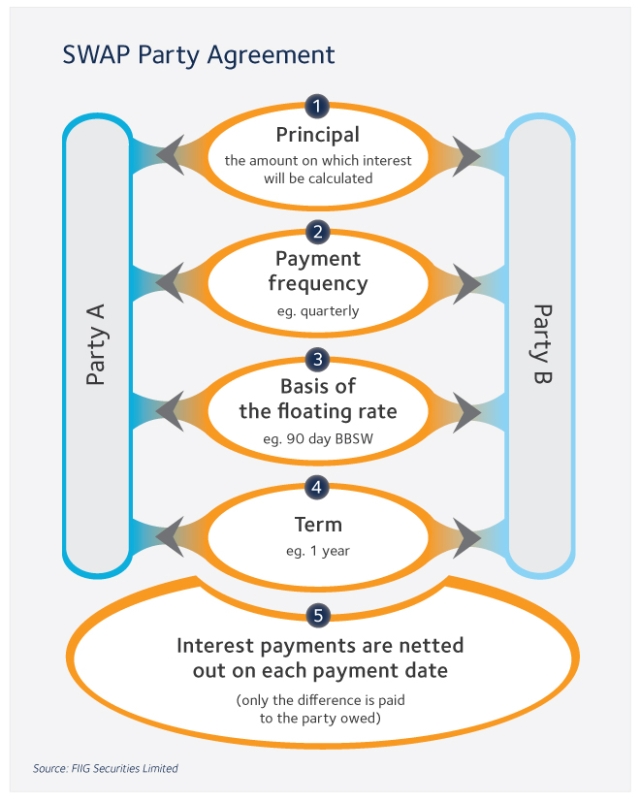
A financial agreement to exchange one set of cashflows for another. A common swap in fixed income markets is an exchange of a fixed interest rate for a floating interest rate. Neither party should receive an immediate gain or loss for entering into an interest rate swap contract thus, the present value (PV) of the fixed cashflows needs to equal the present value of the expected floating rate cashflows to induce either party to contract with one another.

Swap curve
See Swap. A graphical representation of the relationship between swap rates with varying maturities from one week to 30 years. Used as an indication of the direction of interest rates.
Yield curve
A graph showing the relationship between yield to maturity and time to maturity.
Copyright The contents of this document are copyright. Other than under the Copyright Act 1968 (Cth), no part of it may be reproduced or distributed to a third party without FIIG’s prior written permission other than to the recipient’s accountants, tax advisors and lawyers for the purpose of the recipient obtaining advice prior to making any investment decision. FIIG asserts all of its intellectual property rights in relation to this document and reserves its rights to prosecute for breaches of those rights.
Disclaimer Certain statements contained in the information may be statements of future expectations and other forward-looking statements. These statements involve subjective judgement and analysis and may be based on third party sources and are subject to significant known and unknown uncertainties, risks and contingencies outside the control of the company which may cause actual results to vary materially from those expressed or implied by these forward looking statements. Forward-looking statements contained in the information regarding past trends or activities should not be taken as a representation that such trends or activities will continue in the future. You should not place undue reliance on forward-looking statements, which speak only as of the date of this report. Opinions expressed are present opinions only and are subject to change without further notice.
No representation or warranty is given as to the accuracy or completeness of the information contained herein. There is no obligation to update, modify or amend the information or to otherwise notify the recipient if information, opinion, projection, forward-looking statement, forecast or estimate set forth herein, changes or subsequently becomes inaccurate.
FIIG shall not have any liability, contingent or otherwise, to any user of the information or to third parties, or any responsibility whatsoever, for the correctness, quality, accuracy, timeliness, pricing, reliability, performance or completeness of the information. In no event will FIIG be liable for any special, indirect, incidental or consequential damages which may be incurred or experienced on account of the user using information even if it has been advised of the possibility of such damages.
FIIG provides general financial product advice only. As a result, this document, and any information or advice, has been provided by FIIG without taking account of your objectives, financial situation and needs. Because of this, you should, before acting on any advice from FIIG, consider the appropriateness of the advice, having regard to your objectives, financial situation and needs. If this document, or any advice, relates to the acquisition, or possible acquisition, of a particular financial product, you should obtain a product disclosure statement relating to the product and consider the statement before making any decision about whether to acquire the product. Neither FIIG, nor any of its directors, authorised representatives, employees, or agents, makes any representation or warranty as to the reliability, accuracy, or completeness, of this document or any advice. Nor do they accept any liability or responsibility arising in any way (including negligence) for errors in, or omissions from, this document or advice. Any reference to credit ratings of companies, entities or financial products must only be relied upon by a ‘wholesale client’ as that term is defined in section 761G of the Corporations Act 2001 (Cth). FIIG strongly recommends that you seek independent accounting, financial, taxation, and legal advice, tailored to your specific objectives, financial situation or needs, prior to making any investment decision. FIIG does not make a market in the securities or products that may be referred to in this document. A copy of FIIG’s current Financial Services Guide is available at www.fiig.com.au/fsg.
An investment in notes or corporate bonds should not be compared to a bank deposit. Notes and corporate bonds have a greater risk of loss of some or all of an investor’s capital when compared to bank deposits. Past performance of any product described on any communication from FIIG is not a reliable indication of future performance. Forecasts contained in this document are predictive in character and based on assumptions such as a 2.5% p.a. assumed rate of inflation, foreign exchange rates or forward interest rate curves generally available at the time and no reliance should be placed on the accuracy of any forecast information. The actual results may differ substantially from the forecasts and are subject to change without further notice. FIIG is not licensed to provide foreign exchange hedging or deal in foreign exchange contracts services. The information in this document is strictly confidential. If you are not the intended recipient of the information contained in this document, you may not disclose or use the information in any way. No liability is accepted for any unauthorised use of the information contained in this document. FIIG is the owner of the copyright material in this document unless otherwise specified.
The FIIG research analyst certifies that any views expressed in this document accurately reflect their views about the companies and financial products referred to in this document and that their remuneration is not directly or indirectly related to the views of the research analyst. This document is not available for distribution outside Australia and New Zealand and may not be passed on to any third party without the prior written consent of FIIG. FIIG, its directors and employees and related parties may have an interest in the company and any securities issued by the company and earn fees or revenue in relation to dealing in those securities.