by
Dr Stephen Nash | Sep 03, 2013
If the impact of the forthcoming Syrian intervention, the growing appreciation of slowing US growth, and the resumption of an “angry” Congress, become more apparent, then the equity market may well suffer, as it has in most September periods since 1950. Accordingly, this article will seek to explore how investors can avoid September equity market volatility, through considering the following:
- Historical assessment of returns for September
- Estimating annual returns using bond and equity data by switching out of equities in September
- Estimating accumulation of capital using bond and equity data
1 September… the month we would rather forget
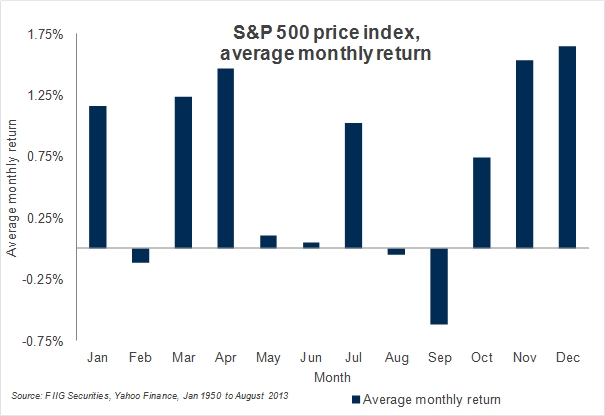
September comes at a crucial time for developed markets, as it marks the return from summer holidays for the northern hemisphere. Average equity return for the S&P 500 Index in the month of September is roughly negative 7.45%, from 1950 to 2013, on an annualised basis, with a very large 15.55% annualised volatility, meaning that one can expect the range of returns to be between roughly 8% and -23%, most of the time.

Figure 1
Looking at the data, in more detail we can see all the September returns in Figure 2 below. Notice, in particular, that most of the occurrences for September are negative, and that the negative outweighs the positive by a large amount, as complacent perceptions of growth are wiped away on the return of the workforce from northern hemisphere summer holidays. Over the 62 observations, 34 years have returned a price return of less than zero and one was zero, while the rest were positive.

Figure 2
2 Allocation switch in September, annual returns
Given that we know that September is a poor month, we can consider a switching strategy, using the S&P Price Index as an estimate of equity returns, and the 10 year swap rate plus 100bps, as an estimate of bond returns, from March 1962 onwards. Here, we switch from a 75% equity 25% bond allocation every September, to a 75% bond and 25% equity portfolio, and then revert back to 75% equity and 25% bond portfolio in October.
We can call this the “September switch”.
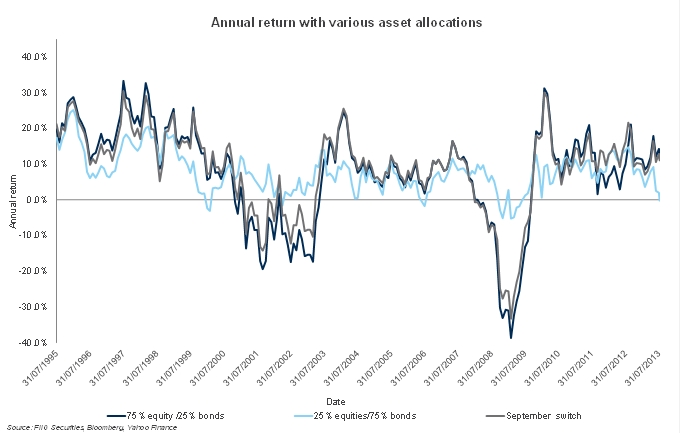
In summary, if we do this “September switch”, then we can increase return from an average annual of 7.51% to 8.31%, while reducing risk from 11.66% to 11.29%. In other words return goes up, while risk goes down. Rolling annual returns are provided in Figure 3, where one can see that the switching strategy, or the grey line, is consistently less volatile than the “no switching” strategy as shown by the dark blue line, while the light blue line is least volatile, which is the allocation of 75% bonds and 25% equities, with no September switching. In particular, the annual returns of the switching strategy show that the switching strategy moderates annual return losses. We focus on the more recent observations, as the complete chart is too detailed to reproduce.

Figure 3
3 Accumulation study
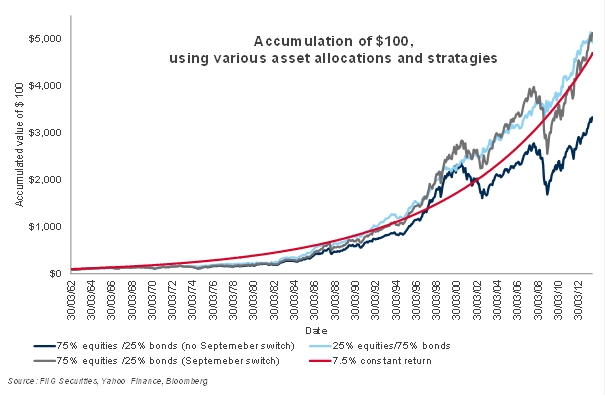
More specifically, we can estimate the return accumulations assuming we invested $100 in four different strategies in March 1962. For example, if the return in the first month was 3%, then the $100 amount would accumulate to $103, and if the return was 3% again, in the second month, then the accumulated amount would move up, from $103, to $106.09.
Figure 4 provides four different accumulation strategies, as follows:
- Allocating the way the so-called “balanced” fund does, 75% to equities and 25% to bonds (dark blue line in Figure 4)
- A bond “balanced” allocation, of 75% bonds and 25% equities, just in September only, and then switching back to the 75% equity and 25% allocation (grey line in Figure 4)
- Using 75% bonds 25% (light blue line in Figure 4) over the whole period
- Estimating an average constant return stream, (red line in Figure 4), just to give an idea of what zero volatility accumulation looks like over time.

Figure 4
Notice how the “September switch” outperforms the “no switch” strategy significantly, and also that the bond biased strategy does very well, however we are only estimating bond returns using the one point on the yield curve, as opposed to using an index of bonds, and that point is quite long, being 10 years maturity.
Conclusion
Sometimes it is good to be more careful than at other times. With a possible intervention by the US and their allies in Syria, the resumption of an “angry” Congress where wrangling between parties over the debt ceiling will become apparent, and the gradual appreciation of slowing US growth, the stage is now set for a difficult September period. As we show, it pays to be careful in September, and if you are, then you can cut your portfolio risk, while also increasing portfolio return.
While September is difficult, and best avoided in terms of investing in equity markets, the volatility of an equity biased portfolio remains a problem for many investors, since it exposes the investor to more risk than is needed, so the use of more bonds, especially in the case of a SMSF, makes a lot of sense at most times; not just in September.