by
Elizabeth Moran | Mar 13, 2013
It’s been a difficult year for Barclays who agreed to pay charges for misconduct in relation to manipulation of LIBOR and EURIBOR, a new CEO in Anthony Jenkins and a commitment by the bank to reduce its compensation ratio. However, very good results from the Corporate and Investment Bank continue to underpin this strong institution.
Key points to note:
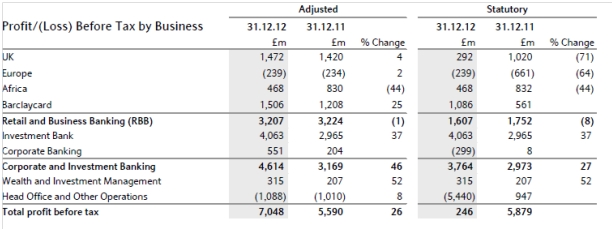
- Adjusted profit before tax was up 26% to ₤7.05bn FY12, with an improvement of 46% in Corporate and Investment Banking and 52% in Wealth and Investment Management. The Investment bank remains the largest contributor to profit (see Table 1)
- Statutory profit before tax decreased to ₤246m (₤5.88bn FY11), including own credit charge of ₤4.58bn (₤2.70bn gain in FY11), gain on disposal of BlackRock investment of ₤227m (impairment/loss of ₤1,858m FY11), ₤1.6bn (₤1.0bn FY11) provision for payment protection insurance (PPI) redress, and ₤850m (₤nil FY11) provision for interest rate hedging products redress
- Investment Bank profit before tax increased 37% to ₤4.06bn driven by income growth of 13% and reduced operating expenses. 4Q12 Investment Bank income was ₤2.60bn, up 43% on 4Q11 but down 2% on 3Q12
- Adjusted return on average shareholders’ equity increased to 7.8% (6.6% FY11)
- Credit impairment charges were down 5% to ₤3.60bn, principally reflecting improvements in Barclaycard, Corporate Banking and UK Retail Business Banking, partially offset by higher charges in the Investment Bank, Africa RBB and Europe RBB
- Adjusted operating expenses were down 3% to ₤18.5bn as non-performance costs were reduced by 3% to ₤16.1bn and performance costs by 4% to ₤2.4bn. Total incentive awards declined 16% for the Group and 20% for the Investment Bank, reducing the Investment Bank compensation to income ratio to 39% (47% FY11)
- Core Tier 1 ratio was 10.9%, slightly down on FY11 of 11.0%. Risk weighted assets reduced 1% to ₤387bn
- The Group raised ₤28bn of term funding in 2012, including ₤6bn through Barclays participation in the Bank of England’s Funding for Lending Scheme (FLS).

Source: Company accounts
Table 1
Lloyds FY12 – Good progress in 2012
Lloyds had a much improved year delivering underlying pre-tax profit of ₤2.61bn, an increase of around ₤2bn over FY11. The result reflected a significant reduction in non-core assets of ₤42.3bn and while income fell by 18% to ₤18.4bn this was offset by costs which declined by 5% to ₤10bn and impairments 42% to ₤5.70bn.
Key points to note:
- Substantial increase in Group underlying profit from ₤638m in FY11 to ₤2.60bn for FY12
- Full year Group net interest margin of 1.93%, in line with guidance
- Costs further reduced by 5% to ₤10.0bn, in line with strategic review target two years ahead of plan;
- Credit quality continues to improve with a 42% impairment reduction to ₤5.7bn, ahead of original guidance. The impairment charge as a percentage of average advances improved to 1.02% (1.62% FY11)
- Statutory loss of ₤570m primarily due to PPI provisions of ₤3.58bn (including ₤1.50bn in 4Q12), and including ₤3.21bn of gains from sales of government securities
- Strong underlying capital generation with Core Tier 1 capital ratio increased to 12.0%; on a pro forma fully loaded CRD IV (new EU rules on capital requirements for banks) basis the ratio is estimated at 8.1%, including 0.3% from expected CRD IV resolutions
- Continued capital accretive non-core asset reduction of ₤42.3bn, benefiting capital ratios, and exceeding initial 2012 guidance by ₤17bn. Non-core portfolio now less than ₤100bn, at ₤98.4bn
- Deposit growth of 4.0%
- Total wholesale funding reduced by ₤81.6bn to ₤169.6bn; maturity profile further improved with less than 30% (45% FY11) of total wholesale funding with a maturity of less than one year
Australian dollar senior debt in both banks now trades in a tight yield to maturity range of 3.10% for a $500,000 face value parcel, maturing 22 November 2013 to 4.08% for the same face value maturing 17 August 2015.