by
Dr. Stephen Nash | Oct 22, 2013
Introduction
In this article we consider the current political climate in the United States, and at home, in some detail, before looking at a format of fixed income that has extremely strong diversification benefits for an investment portfolio as a whole. Specifically, we:
- Analyse the current policy environment, both in the US and in Australia,
- Consider how the policy environment is starting to drive economic outcomes, and
- Consider the portfolio construction implications of not having inflation linked bonds.
1. Policy environment
While FIIG has pointed out the impact of political risk earlier than others, the financial market remains largely unconcerned, as a deal in the US was finally executed last week. Specifically, the debt ceiling will be raised for a short time; until February 7 2014, while the government will be funded until January 15 2014. However, the consequence of the debt wrangle lingers in the following three ways:
- Government shutdown and impact on the economy: There is no one definitive estimate of the cost of the past government shutdown on the economy at this time; be they direct taxpayer costs taken for paying salaries that delivered no value, or the indirect costs, which are much larger. While estimates vary, Standard and Poor’s estimated the cost on the US economy to be roughly 60 basis points off annual GDP growth, or around $24 billion USD,
- Fiscal lever now eliminated: No matter what the Democrats do they remain unable to foster any new fiscal initiatives, mainly because of the ardent position of the Republicans, so the US economy continues to suffer from the impact of the existing sequester, and
- Wrangle to drag growth lower in the current quarter: Participants in the economy will change economic decision-making as a result of the deal above. Expansion plans will be trimmed on the supply side of the economy, while holiday spending will be moderated on the demand side of the economy. With less investment and less spending it is likely that economic growth will be fairly slow this quarter. Hence the 60 basis point cut in terms of GDP from the shut-down is just the start of the impact on growth.
Meanwhile, in Australia, the economy remains at sub-trend growth, as the economy tries to rebalance; from mining led growth to non-mining led growth. As the post-election growth spurt takes shape, it can be anticipated that some financial market forecasters will anticipate a tightening of monetary policy in Australia. However, we anticipate that these calls will not be headed by decision-makers at the RBA, who will need to see confirmation of any new growth before changing policy direction. After some time, settlement of growth should occur back towards sub-trend levels and this should allow the RBA to act on the current forward guidance; i.e. for the RBA to ease again in 2014. Also, we anticipate that the very moderate readings of underlying inflation, in the CPI release of today, should allow plenty of scope for the RBA to further ease monetary policy.
2. Policy environment and economic surprise
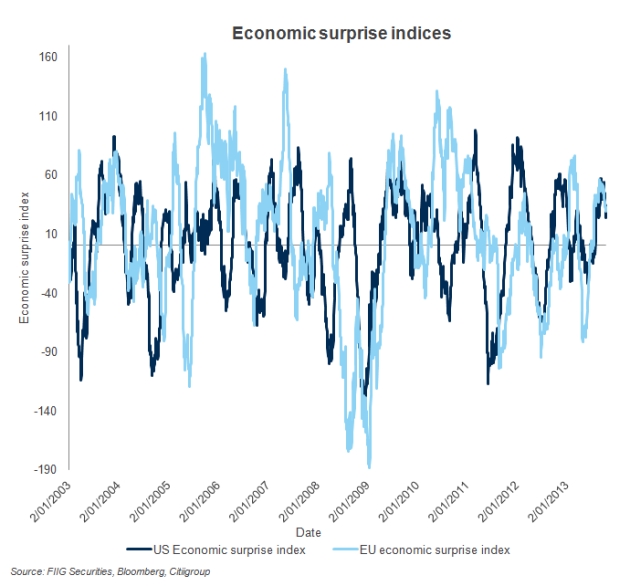
Given the above drags on growth, it would be interesting to see if the policy environment is beginning to impact the economy. A useful tool for assessing this impact is the Citigroup suite of Economic Surprise indices. These indices are quantitative measures of how actual economic news compares to the survey of forecasts, as provided by Bloomberg. While a positive reading of the Economic Surprise Index indicates that releases are better than expected, the reverse is also true. As we show below in Figure 1, releases are quite volatile relative to expectations.

Figure 1
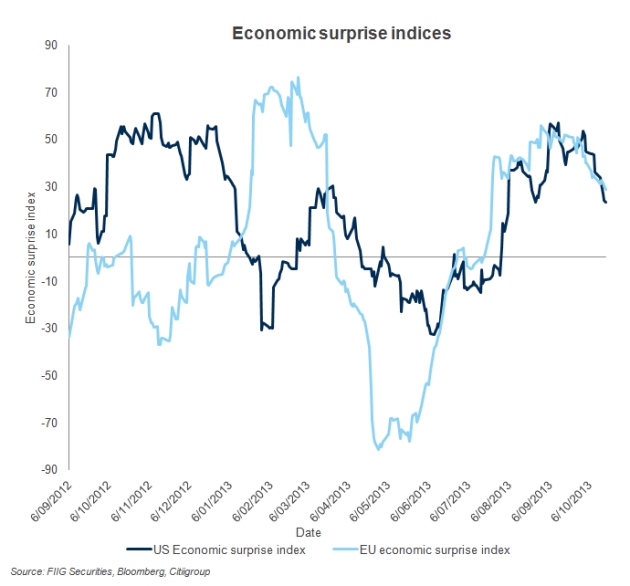
Now, more recently, one can see that the index has begun to swing down, as shown in Figure 2 below, meaning that releases are starting to come out weaker than expected, especially since September 2013. Among other things, this suggests the anticipation of the recent US political wrangling has already had a negative impact; more is to come.

Figure 2
3. Inflation risk and equity return
If the policy environment is now not supportive of growth, as we suggest in section 1, and if that decline in growth is beginning to be reflected in economic releases, as suggested in section 2, then one needs to review the relationship of equity performance and equity return. Specifically, if equity performance suffers, then one cannot use these securities to fund retirement spending; spending that is all related to variations in the CPI. Moreover, as income falls the investor faces more and more volatile inflation as more and more of total income is spent on the volatile components of the CPI. Reviewing such a relationship, between equity return and inflation, is also timely given that Australian CPI is released today.
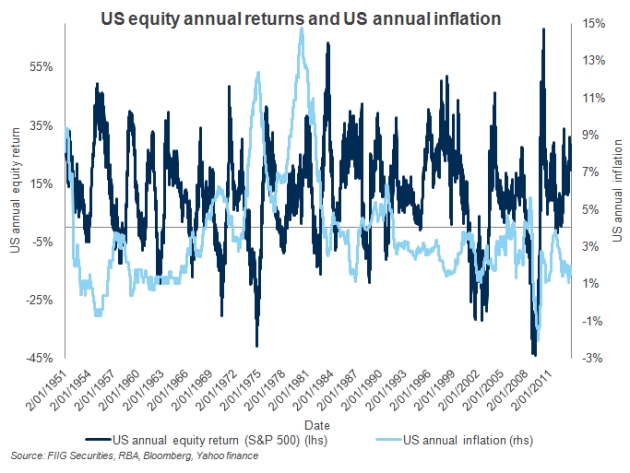
In order to analyse the relationship, between annual equity return and annual inflation, we use US data as we can examine a longer period, with both US equity returns (using the S&P 500) and the US CPI available from 1951. Firstly, we review the annual return series for both US equities and for US annual inflation, as shown in Figure 3 below. Note how annual equity return is not only volatile but that it generally tends to move in the opposite way to annual inflation. Note, in particular, where inflation rose due to oil price rises in the 1970s, and how equity returns failed to move with inflation. Hence equity returns tend to have a negative correlation with equity return; the opposite of what retirees need and what most investors expect. Such a negative relationship makes sense from a logical point of view, as follows:
- when inflation is high, interest rates rise and constrain growth, so growth suffers and so does annual equity performance, and
- when inflation is low, it becomes apparent to market participants that the economy is not impeded by high interest rates, so growth is higher and equity performance is higher.

Figure 3
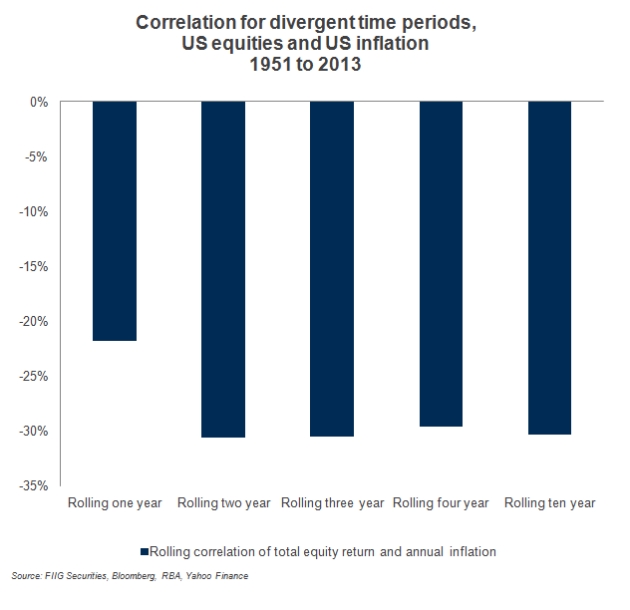
Now, if this negative correlation is apparent, it would be interesting to see if it persisted over different rolling time periods. Hence, in Figure 4 below, we look at rolling annual return correlations over different rolling periods.
For all the periods we used: from rolling one year, to rolling ten year, the average correlation remains negative. This is also true for the total period, with over 15,000 annual observations; the correlation is still negative; around -15%. Although not shown in Figure 4 below, it could be argued that, over a long period of time, while the negative correlation between annual equity return and annual inflation moderates, the relationship is not a positive one over any time period.

Figure 4
Hence, one needs to break the myth about equity returns and inflation; there is no observable positive correlation on average, and if anything, the correlation is negative; annual equity return generally moves in the opposite direction to annual inflation. Against all this risk that equities pose, relative to inflation, one needs to bear in mind that a 4% real return or return of 4% above inflation, has yielded a handsome 7.70% in average annual terms since 1951 in the United States, and with a zero risk to inflation, if inflation linked bonds were used. In contrast, while equities provided more return, around an average of 11.25% for the period 1951 to 2013, they generated that return with a whopping 16.86% annualized risk to inflation. In other words, you get more return from equities, yet the return comes with a massive risk to the main driver of retirement expenses; the rate of inflation.
Conclusion
Sometimes myths help us do things, or achieve objectives, which might be more difficult in the absence of that myth. For example, many political philosophers over the years have argued that political association is made possible by what is referred to as the “noble lie”. Yet, when one has one’s retirement spending on the line, the need to be careful and to avoid mythmaking is paramount, especially in the current environment of “fear and loathing” in Washington. We argue that the current impact of political wrangling is only just becoming apparent in terms of the economy, as seen in recent readings of the Economic Surprise index.
More, much more, is to come.
If you think that rationality will prevail, in terms of the forthcoming negotiations in Washington, then we would strongly urge you to think again. What will happen in early 2014 will set the scene for the November 2014 mid-term elections and that means that our little preview in October, this year, will suddenly become more serious, and more damaging for the economy. At best, one can imagine that another delay of agreement on the debt ceiling will occur.
This means that equities face an ongoing problem; economic growth will be hampered by continuing political risk, and the idea that one can obtain a hedge against inflation by using equities needs to be thoroughly re-examined. We argue that those relying on equities for retirement spending, on the premise that annual equity return is positively correlated to the annual CPI, are effectively living in hope; a dangerous way to live when political risk is such a large issue right now.
This is why in such an environment the use of inflation linked bonds, at around a real yield of 4%, makes a lot of sense. Some possible ILBs to consider, which assist with inflation hedging, at generous real yield levels are as follows:
- Jem Schools 2035 at 3.90%,
- Electranet 2015 at 2.60%,
- ANU 2029 at 3.35%,
- Sydney Airport 2020 at 4.20%,
- Sydney Airport 2030 at 4.50%, and
- Queensland Treasury 2030 at 2.80%.