by
Dr Stephen J Nash | Oct 31, 2012
Inflation linked bonds will increase their capital value by just under 1% this quarter. We also expect a further significant capital uplift next quarter. The case for ILBs remains compelling, given the comparison to other asset class returns and risks.
Uplift calculation
Last week the Australian Bureau of Statistics (ABS) released the consumer price index (CPI), which measures the changes in the price levels of consumer goods and services, as purchased by households. Understanding how the CPI feeds into the adjusted capital price is important, as investors need to know how CPI changes influence the price/ return of their ILB investments. This procedure is generally known as the “uplift” to the adjusted capital price.
AOFM define way the uplift of most capital indexed bonds works, as follows:

(rounded to two decimal spaces), where
- CPIt is the Consumer Price Index for the second quarter of the relevant two quarter period
- CPIt-2 is the Consumer Price Index for the quarter immediately prior to the relevant two quarter periods. An example would be the Sydney Airport 2030 uplifts, which can be calculated as follows:
First, investors need to define the relevant CPI dates and values. This information is available from the RBA website, as shown in the first column of Figure 1 below. Here,
- CPIt is September 2012, which corresponds to the CPI index value of 101.80
- CPIt-2 is March 2012, which corresponds to the CPI index value of 99.90
Then insert these values into the above formula, so the formula is as follows:


P is then used to increase, or ‘uplift’ the capital price of the bond to the new adjusted capital price, as shown below in Figure 1 (1).
Using this formula, you can then determine a series of capital uplifts for the Sydney Airport 2030 ILB, as follows:
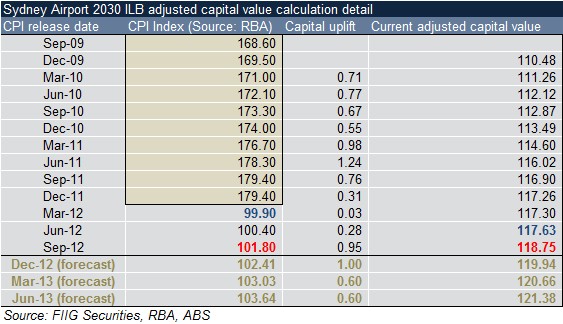
Figure 1
In this case, the ILB outcome means that the adjusted capital price of the bond goes up by 0.95%, as shown in the third column of Figure 1. Hence the old adjusted capital value, of 117.63 (the blue number in the right hand column) is multiplied by 1.0095 (rounded to 4 decimals), to obtain 118.75, rounded to 2 decimals, (the red number in the right hand column), as shown in the right hand column of Figure 1. This means that the ILB issuer now has an obligation to pay 118.75, not 100, or the prior 117.63, to the investor, upon the maturity of the bond. Also, the coupons are now based on the new capital price of 118.75, so the 3.12 % coupon is now multiplied by 1.1875, which means that the new coupon effectively increases from 3.6701% to 3.7050%, rounded to 4 decimal places. While the coupon payment stays at 3.12%, the increase in the adjusted capital price effectively lifts the coupon payment in line with the new repayment commitment of the issuer. Each quarter, the ILB has a stable adjusted capital value, which can then be priced like any other bond.
The capital uplift in the September quarter of 2012 is greater than the June quarter, and if the CPI trends continue in the middle of the RBA band, at 2.5%, then we would expect an increase of roughly 3.2%, for the year ended June 2013, or roughly 0.7% per quarter for the year ended June 2013. This is because, as the RBA and the Commonwealth government have indicated, the carbon tax will add roughly 70 basis points to the CPI for the year ended June 2013. This will lead to a series of substantial improvements in the adjusted capital price of all ILBs over the year ended to June 2013. As the RBA commented,
The introduction of the carbon price in July is expected to boost headline inflation by around 0.7 percentage points over the year to June 2013 (Statement of monetary Policy, May 2012, p.4).
(Please click on the link to access the “What is the CPI” article)
Investors can see how the adjusted capital price of ILBs has grown of late, as well as forecast increases, with reference to the time series shown in Figure 2 below, which illustrates the anticipated adjusted capital price of the Sydney Airport 2030.
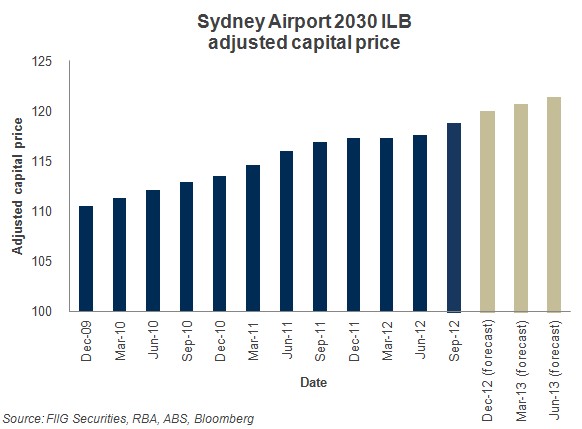
Figure 2
Another way to look at the increase in adjusted capital price (ACP) is to look at the percentage change in the ACP for each individual quarter, as shown in Figure 3 below. Note the prospect of substantial increases to the ACP, when compared to prior increases.
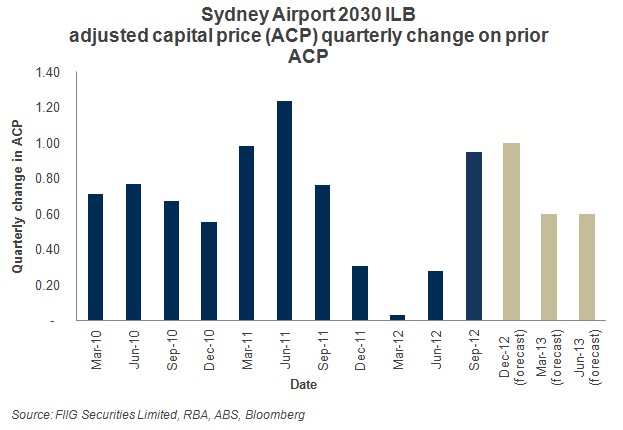
Figure 3
Also, we can summarise the forecast in Figure 4 below, where the forecast increase is compared to the past four quarters. If the forecast is accurate, then investors will obtain around double the average increase in ACP that they received in the last four quarters. Alternatively, if all the prior quarters are averaged from March 2010 to September 2012, then the forecast ACP increase is going to be around 10% larger than the average for all the previous quarters.
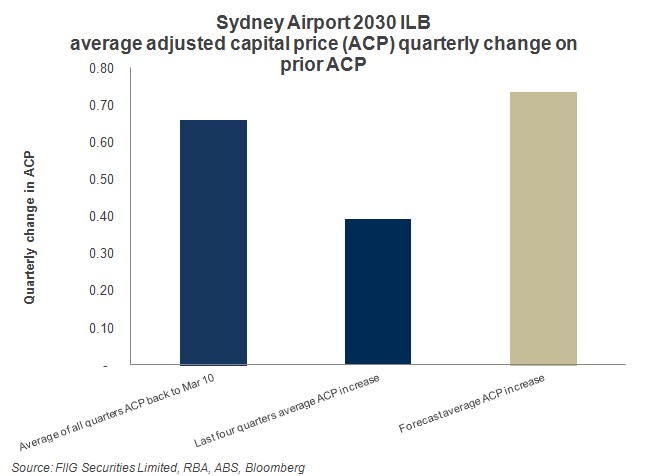
Figure 4
ILBs at 4.5%, compared to other asset classes
So, it appears that we are looking forward to a period of elevated inflation, due to the carbon tax. If that inflation is “sticky”, or works its way into the system, then we will need more inflation protection, and with the current level of economic stimulation in the system, we might expect elevated inflation outcomes. Yet, if we receive around 4.5% (which is where the Sydney Airport 2030’s are trading) above inflation, we need to see how that compares to the average annual return for other asset classes. Specifically, as data available from the RBA indicates, annual inflation has averaged about 2.61% over the period March 1991 to September 2012, meaning that a 4.5% real return would deliver around 7.11% nominal (2).
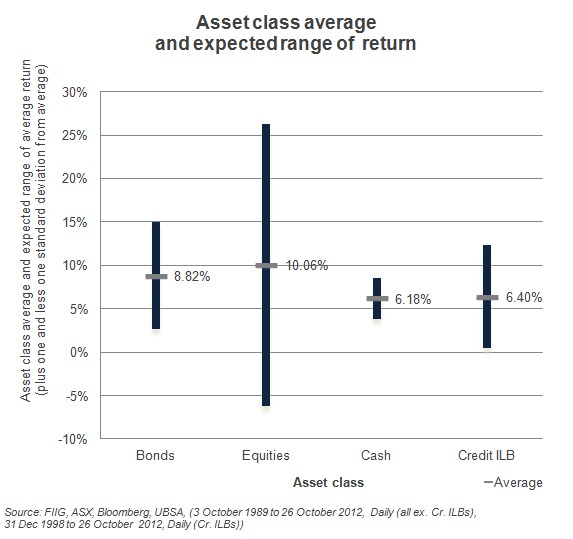
Figure 5
While Figure 5 shows average returns, it also shows the possible range of average returns, which is very important when considering investment, where the credit ILB is the Credit ILB 0+ year index, which comprises all the AUD investment grade credit ILBs. Here, the high of each bar is the average return plus one standard deviation, while the low is the average return less one standard deviation. Apart from other things, this graphic gets across the idea of variability well. This is the range of outcomes that, according to standard statistical theory, we would expect most of the time. While bonds have a fairly large range of returns, relative to cash, that range is small relative to the range for equities. As Figure 5 indicates, over a very long period of time, 4.5% over inflation, or 4.5% real, is a very competitive return, although less than that is shown in Figure 5, as Figure 5 shows the historical return of the Credit ILB asset class, as indicated by the UBS Credit ILB 0+ year index. Such an average historical return is just that; it has little to do with looking forward, so the lower return for the Credit ILB has little to do with forward estimate of return.
While Figure 5 is interesting, it tells us little about forward expectations of return, except for the risk estimates, which we assume will remain reasonably stable over the next ten years. Accordingly, in Figure 6, we estimate average returns of the major asset classes over the next ten years, and use the risk estimates derived above in Figure 5, to derive the range of return estimate. For a corporate ILB with a real yield of 4.50% and an inflation rate of 2.61%, (annual average CPI from March 1991 to September 2012) the ILB should achieve a return of 7.11%. I estimate fixed rate bonds, which include Commonwealth government bonds, Semi-government bonds, supranational bonds, and corporate bonds, should achieve an average return of around 4.5%, meaning further modest fall in yields and a period of low rates over the forecast period. Note that this estimate is weighed down by all the government debt in the Composite Index, which is currently low in yield. Cash should average a little lower, with an average yield of around 4.00%, as interest rates are set to go lower soon, possibly a lot lower, before going back up at the end of the forecast period. Equities will struggle to match historical performance with an average return of around 7%, given ongoing lower global growth for the next few years.
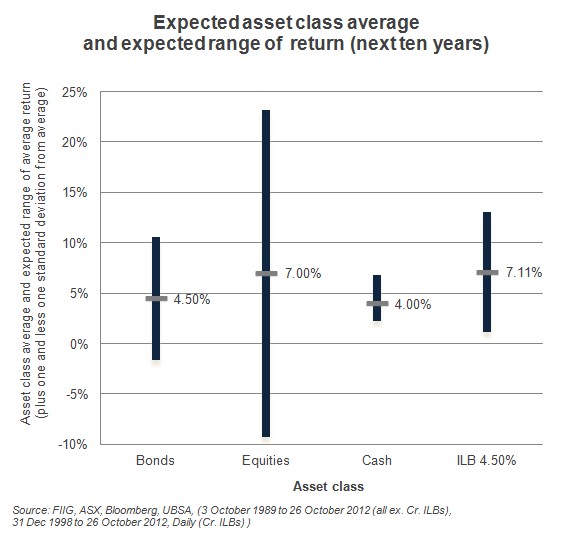
Figure 6
In Figure 6, we estimate risk and return over the next ten years, as opposed to the index in Figure 5. While the return for the ILB can be estimated by the addition of the real rate to the expected inflation rate, the risk estimate is based on the risk of the index, derived in Figure 5. By ignoring the mark to market volatility of longer dated ILB securities and discounting credit risk, and then focusing on the underlying return, it becomes apparent that an ILB with a real yield of 4.50% tends to beat the expected equity return with much less risk, along with the other asset classes. In order to reach out and garner all that return in equities, investors are forced to take on an enormous amount of risk, or variability in return. Investors need little reminder of this variability at this time.
However, corporate ILBs, such as the Sydney Airport 2020s and 2030s do not expose a portfolio to the inherent capital structure risk of equities. While equity holders are the most exposed to capital risk, as they are the lowest rung on the capital structure, senior bondholders are towards the very top, as we have indicated in many previous articles. This means, apart from other things, that recognition of mark to mark volatility becomes much more relevant the lower in the capital structure the investment is, since those who hold the highest risk, equities, will suffer most under stressed conditions. By investing in corporate ILBs investors can achieve an equity style return while maintaining a conservative position in the capital structure, where they are much more secure than equity holders. The Envestra ILB offers a 4.15% real return, while the Sydney Airport 2030s, a 4.50% real return over inflation.
Conclusion
We expect increased inflation next financial year due to the carbon tax and this will flow through to ILBs, increasing the adjusted capital price, which will lead to higher returns not only through the higher capital value but also via a higher coupon payment based on the face value. While ILBs cover inflationary risks, they only marginally reduce return, although greatly lower overall portfolio investment risk compared to equities. The Sydney Airport 2030s currently offer a real yield of over 4.50% and represent equity like returns for senior debt. Looking forward, ILB returns at 4.50% will be very hard to beat.
To learn more please click here and here for recent Sydney Airport research.
(1) An extra complication this quarter is the re-basing of the CPI index, which the Australian Bureau of Statistics (ABS) explain below,
From the September quarter 2012, all index numbers will be calculated on a new index reference period of 2011-12. This will result in the index numbers for each index series being reset to 100.0 for the financial year 2011-12. Period-to-period percentage changes may differ slightly to those previously published due to rounding and the re-referencing. These differences do not constitute a revision. (Source: http://www.abs.gov.au/AUSSTATS/abs@.nsf/mf/6401.0)
Old index data is shown in the brown box in Figure 1, while new index data comes after the old data, and begins with 99.90.
(2) Asset class returns are estimated using the following data:
Equities: All ordinaries accumulation, 3 October 1989 to 26 October 2012, daily
Fixed rate bonds: UBS Composite 0+yrs., 3 October 1989 to 26 October 2012, daily
Cash: UBS Bank Bill index, 3 October 1989 to 26 October 2012, daily
Credit ILB: UBS Credit ILB Index 0 + yrs, 31 Dec 1998, to 26 October 2012 Daily
Risk is estimated by deriving the annual standard deviation of return for all index data.