by
Elizabeth Moran | Nov 21, 2012
The last quarterly inflation release took the market by surprise. For the quarter ended September 2012, headline CPI rose 1.4% (as published by the Australian Bureau of Statistics). Although the RBA had flagged that inflation would be higher with the new carbon tax, analysts were surprised by how fast this fed through and by higher prices of other goods and services (see my previous article “Lessons from the US – Inflation linked bonds offer more than protection from inflation”).
This CPI increase worked to increase the capital adjusted value of the most common form of inflation linked bonds; the capital index bond. In fact, it worked to increase their capital value by almost 1%. Today I want to show you how the changes in the CPI feed through to increase the capital value of capital index bonds and let you know about the other type of inflation linked bond – the annuity indexed bond.
What is the Consumer Price Index?
The CPI measures quarterly changes in the price of a 'basket' of goods and services which account for a high proportion of expenditure by the CPI population group; that is metropolitan households. This 'basket' covers a wide range of goods and services, arranged in the following eleven groups:
- Food and non-alcoholic beverages
- Alcohol and tobacco
- Clothing and footwear
- Housing
- Furnishings, household equipment and services
- Health
- Transport
- Communication
- Recreation and culture
- Education
- Insurance and financial services
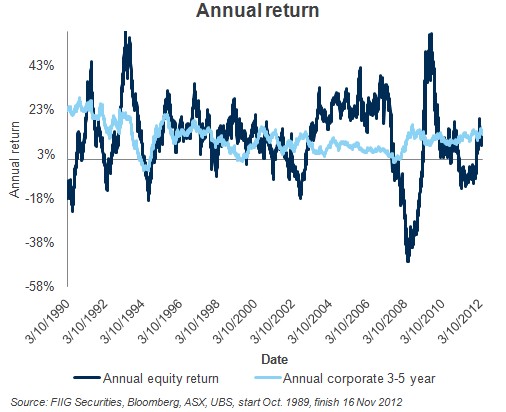
Rolling annual changes to inflation as measured by the CPI are shown in Figure 1 below.

Figure 1
The biggest quarterly increases were to Housing 3.2%, Health 2.4% and Food and non-alcoholic beverages of 1.9%. In the 12 months to September 2012, the largest yearly change in prices of the 11 groups was to Health, which increased by 7.2% over the prior yearly period; followed by Education of 6.1% and Housing of 4.7%. For more information regarding the CPI please see the Australian Bureau of Statistics website at www.abs.gov.au.
Capital index bond (CIB) – How the CPI feeds through to higher capital values
The most common inflation linked bond (ILB) is the capital indexed bond (CIB) where variations in inflation during the life of the bond are added and subtracted to the capital price of the bond, which results in what is known as ‘the adjusted capital price’.
Understanding how the CPI feeds into the adjusted capital price is important, as investors need to know how CPI changes influence the price/ return of their ILB investments. This procedure is generally known as the “uplift” to the adjusted capital price.
The Australian Office of Financial Management (a specialist Australian Government agency) define the way the uplift of most capital indexed bonds works, as follows:

(rounded to two decimal spaces), where
- CPIt is the Consumer Price Index for the second quarter of the relevant two quarter period
- CPIt-2 is the Consumer Price Index for the quarter immediately prior to the relevant two quarter periods.
An example would be the Sydney Airport 2030 inflation linked bond uplifts, which can be calculated as follows:
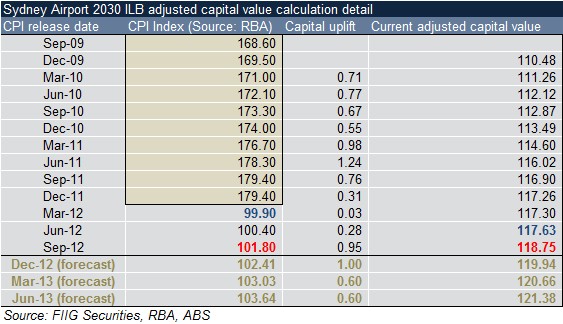
First, investors need to define the relevant CPI dates and values. This information is available from the RBA website, as shown in the first column of Table 1 below. Here,
- CPIt is September 2012, which corresponds to the CPI index value of 101.80
- CPIt-2 is March 2012, which corresponds to the CPI index value of 99.90
Then insert these values into the above formula, so the formula is as follows:


P is then used to increase, or ‘uplift’ the capital price of the bond to the new adjusted capital price, as shown below in Table 1 (1).
Using this formula, you can then determine a series of capital uplifts for the Sydney Airport 2030 ILB, as follows:

Table 1
In this case, the ILB outcome means that the adjusted capital price of the bond goes up by 0.95%, as shown in the third column of Figure 1. Hence the old adjusted capital value, of 117.63 (the blue number in the right hand column) is multiplied by 1.0095 (rounded to 4 decimals), to obtain 118.75, rounded to 2 decimals, the red number as shown in the right hand column of Figure 1. This means that the ILB issuer now has an obligation to pay 118.75, not 100, or the prior 117.63, to the investor, upon the maturity of the bond. Also, the coupons are now based on the new capital price of 118.75, so the 3.12% coupon (set at first issue of the bond) is now multiplied by 1.1875, which means that the new coupon effectively increases from 3.6701% to 3.7050%, rounded to 4 decimal places. While the coupon payment stays at 3.12%, the increase in the adjusted capital price effectively lifts the coupon payment in line with the new repayment commitment of the issuer. Each quarter, the ILB has a stable adjusted capital value, which can then be priced like any other bond.
The capital uplift in the September quarter of 2012 is greater than the June quarter, and if the CPI trends continue in the middle of the RBA band, at 2.5%, then we would expect an increase in the annual CPI of roughly 3.2%, for the year ended June 2013, or roughly 0.6% per quarter for the year ended June 2013. This is because, as the RBA and the Commonwealth government have indicated, the carbon tax will add roughly 0.70% (70 basis points) to the CPI for the year ended June 2013. This will lead to a series of substantial improvements in the adjusted capital price of all ILBs over the year ended to June 2013. As the RBA commented,
The introduction of the carbon price in July is expected to boost headline inflation by around 0.7 percentage points over the year to June 2013 (Statement of monetary Policy, May 2012, p.4).
Examples of issuers of capital indexed bonds include: The Australian Office of Financial Management on behalf of the Commonwealth Government, NSW Treasury Corp, Commonwealth Bank, Envestra, Praeco, Rabobank and Sydney Airport.
Inflation indexed annuities (IIAs)
Inflation indexed annuities (IIAs) return both principal and interest at each preset payment date over the life of the bond, until the maturity date instead of one lump sum at maturity like the CIB. This is an annuity, but the annuity is ‘indexed’ to inflation.
Just like paying a mortgage loan back to a bank, the issuer of the bond pays principal and interest to the investor. In the absence of any indexation (inflation), each payment would be equal, consisting of part principal and part interest. This amount is also referred to as the base payment or ‘base annuity’. The base payments are indexed (by inflation) over the life of the asset. Assuming that inflation is positive, there is a steady increase in the payments over the term to maturity.
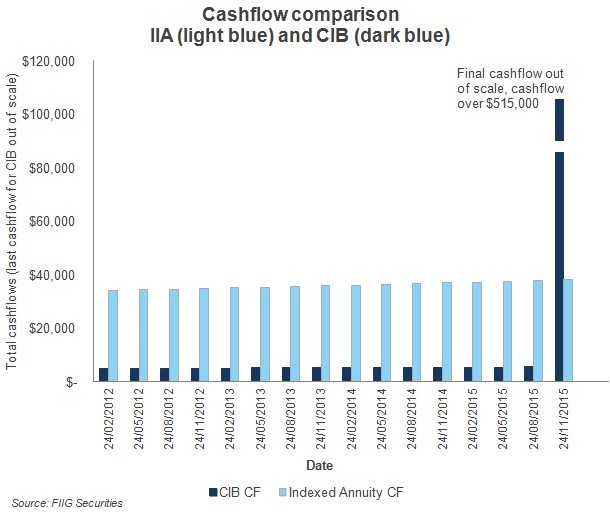
IIAs offer investors a cash stream that will increase with inflation, so are perfect for investors in retirement. In Figure 2, the annuity payments are shown as the light blue bars.
Notice how the IIA has much larger, and more even cashflows, while the CIB cashflow (the dark blue line) grows over time and has one large payout at maturity.

Figure 2
Examples of issuers of annuity indexed bonds include: Praeco, JEM (Southbank Tafe), and Civic Nexus.
(1) An extra complication this quarter is the re-basing of the CPI index, which the Australian Bureau of Statistics (ABS) explain below,
From the September quarter 2012, all index numbers will be calculated on a new index reference period of 2011-12. This will result in the index numbers for each index series being reset to 100.0 for the financial year 2011-12. Period-to-period percentage changes may differ slightly to those previously published due to rounding and the re-referencing. These differences do not constitute a revision (Source: http://www.abs.gov.au/AUSSTATS/abs@.nsf/mf/6401.0)
Old index data is shown in the brown box in Table 1, while new index data comes after the old data, and begins with 99.90.