by
Elizabeth Moran | Dec 19, 2012
This is my last article for 2012 and as the year draws to an end it seems like a good time to summarise issuance. Have a guess at the total Australian dollar fixed income issuance for 2012? Now estimate the percentage issued over the counter (OTC) in the wholesale market versus issuance listed on the Australian Stock Exchange (ASX). Total issuance for the combined markets for 2012 was $119.63bn with the over the counter market comprising 89.41% of the total market (excluding asset backed securities and residential mortgage backed securities) (see Table 1 below).
Source: FIIG, Bloomberg, UBS
Note: Does not include asset backed securities (ABS) or residential mortgage backed security (RMBS) issuance
Table 1
Issuance by month varied (see Figure 1) with the majority of issuance in March when credit spreads (the amount the company has to pay to issue the bonds over the market price) was lowest, as depicted by the yellow line. While the blue columns in Figure 1 show the value in billions of issuance. Credit spreads again contracted in recent months but issuance did not reach the March highs, perhaps due to significant foreign currency issuance by Australian banks and corporations.
Figure 1
The OTC market dominated as expected given fewer conditions of issuance, a ready market and generally lower costs given companies do not have to comply with more onerous retail rules. Drilling into this market (see Table 2), the largest sector was the financial and corporate sector issuing 57% of the OTC issuance. Total government issuance (Commonwealth and state and territory) comprised roughly 30% of the market, while supranational issuance (a supra-national is an international government or quasi-government organisation that typically exists in multiple countries, for example The World Bank Group or the International Monetary Fund) made up the remainder.
Covered bonds, issued for the first time in Australian dollars this year, became an increasing source of cheap funding for our domestic banks who issued $13.05bn (12.2% OTC issuance). Covered bonds are very low risk and secured by a pool of mortgage loans. I expect covered bonds to be a growing market in 2013.
During the year there was a general preference for most issuers to issue fixed rate bonds (the Commonwealth does not issue floating rate notes) perhaps an indication of the low rates available although financial and corporate issue was roughly equal given companies often issue a fixed and a floating tranche at the same time to diversify funding and as a hedge against interest rate movements. There was only one inflation linked bond which was issued by the Commonwealth government.
Source: FIIG, Bloomberg, UBS
Note: Issuance includes the Euro medium term note issues that were issued in Australian dollars
Table 2
Given that the financial and corporate sector was the largest, it’s worth assessing in greater detail. By far the largest issuers in this bracket were the banks, issuing 66% of the total and if you add diversified financial issuers of 13% then 79% of financial and corporate issuance was by financials (see Figure 2). This goes some way to explaining the strong demand for corporate issuance (investors need diversification in their portfolios), driving credit spreads down. For example BHP’s recent A$1bn issue was at a very low spread of BBSW + 90bps, at that time lower than the spread that one of the major banks could issue. So despite a lower credit rating a more cyclical business and no oversight by APRA, BHP was able to issue very cheaply in the wholesale market. The issue was oversubscribed and had bids of over $2bn. The very low cost to BHP and the ease of issuance in part explains why there’s no need for BHP to tap the ASX listed retail market.
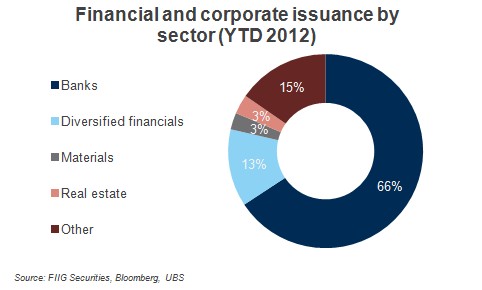
Figure 2
Table 3 shows a list of the 74 banks and companies that issued bonds in the OTC wholesale market in 2012. There’s a good mix of domestic and international issuers. The major four banks were the largest issuers and combined issued $27.48bn or around 45% of the total financial and corporate issuance. Westpac was the largest single issuer, issuing $9.7bn.

Source: FIIG, Bloomberg, UBS
Note: Issuance includes the Euro medium term note issues that were issued in Australian dollars
Table 3
In contrast, ASX listed issuance was 10.59% of A$ total year to date fixed income issuance. A total of 16 issuers issued $12.67bn worth of bonds and hybrids. Financial institutions, excluding insurers issued $9.60bn (75.8%) of the total. The largest issuer was Westpac with its two issues WBCPC and WBCHA totalling $2.87bn or 22.6% of total ASX issuance.
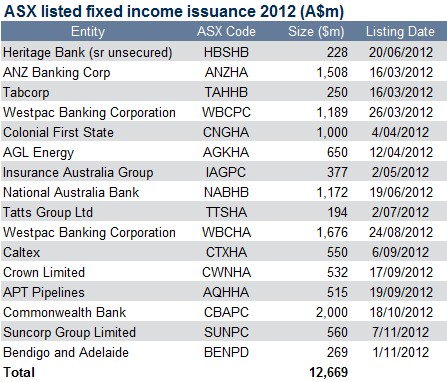
Source: FIIG, ASX, AFR
Table 4
There hasn’t been any ASX listed issuance this month, in part due to the credit rating agency Standard and Poor’s announcing that they were reviewing the “equity credit” status applied to some hybrids. The implication being that if the status is changed and considered debt, it could change the company financial ratios and may harm the company’s credit rating.
I’m very much of the view that interest rates will be lower for longer, meaning bond issuance in both the OTC and listed markets will remain attractive in 2013.