by
Dr Stephen Nash | Oct 29, 2013
Key Points:
1. Macro economic data suggests global growth is lower than forecast.
2. Investors should consider if they have a sufficient allocation to fixed rate bonds should growth remain low for a longer period.
3. The current steepness of the yield curve incorporates a higher growth expectation that what we expect, offering opportunities in fixed rate bonds that we expect will erode as the market realises growth projections are too high.
For a country that has such a high asset allocation to shares, the need to diversify that exposure is important. In this article we consider the current macro-economic environment, before looking at how well FRNs diversify share portfolio returns relative to fixed rate debt and how the steepness of the Australian yield curve presents an opportunity for investment in fixed rate debt.
Macro-economic environment – data is worse than expected
Fiscal uncertainty will plague the US economy in the next few months as consumers refuse to spend because they are concerned about another government shutdown, while producers refuse to expand capacity because they are worried about a shut down along with the possibility of a US default. The US government cannot stimulate the economy using fiscal policy and is currently failing to meet high expectations of growth as illustrated by the Citigroup Economic Surprise Indices (see Figure 1). Specifically, these indices measure actual releases, when compared to expectations of those releases. When economic data comes out better than expected, then the Index rises above zero and when the data fails to meet expectations, the Surprise Index declines, as we have witnessed since September 2013. Also, the Chinese economy is beginning to experience a similar disappointment in recent releases, as the Chinese try to stabilise a surging property market, by constraining credit growth.

Figure 1
Since September 2013 the economic data has begun to disappoint, and once the data turns, it tends to turn for a significant time. When the data begins to badly disappoint, as seems likely in the next few months, the need to diversity share returns will become much more urgent for many Australian investors.
How annual FRN performance moves, relative to other asset classes
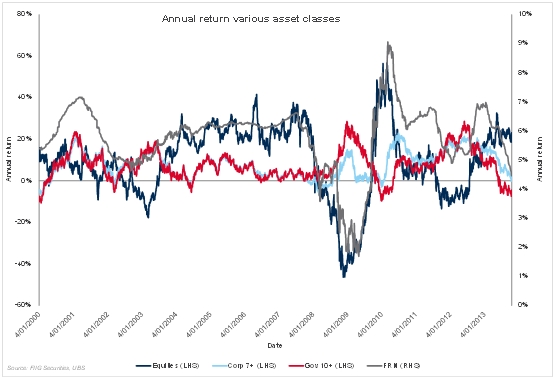
When economic data disappoints, as we indicate above, fixed rate bond prices tend to outperform, relative to FRNs, while shares tend to either not rise in price, or fall in price. In the following graph, we use the following indices to demonstrate the relationships:
- UBS Treasury 10 year plus index (Gov 10+ in the below Figure, and the red line)
- UBS FRN Index zero plus yrs., (FRN in the below Figure, and the grey line)
- UBS Fixed Credit 7 years plus (Corp 7+ in the below Figure, and the light blue line)
- All Ordinaries Accumulation (Equities in the blow Figure, and the dark blue line)
If you have a portfolio that is dominated by equity risk, then you are typically looking for an asset that moves in the opposite direction (in terms of annual return) to increase portfolio diversification, where potential losses in one asset will be offset with gains in the other asset. However, Figure 2 shows that the FRN Index, as shown by the grey line below on the left hand axis, tends to move almost in lockstep with annual share return. By way of contrast the annual return on fixed rate bonds tend to move in the opposite direction, as indicated by the light blue and red lines in the below graph on the right hand axis.

Figure 2
Now, if we try and quantify how FRNs move, relative to other assets, we can derive the below correlation matrix, which shows that the annual return of the FRN Index is significantly correlated to the annual return of the share index, the All Ordinaries Accumulation Index. This means that FRNs do not diversify a portfolio that has a lot of share risk, as high correlation means that the annual return of shares and the annual return of FRNs will, on average, tend to move in the same direction.

Source: FIIG Securities, UBS annual return correlation 1999 to 2013
Table 1
However, FRNs do help diversify a purely fixed income portfolio, as the correlation between FRNs and fixed rate bonds is low, especially in the case of government bonds.
The best diversifier for an equity portfolio is long dated fixed rate government bonds (see Table 1) quickly followed by long fixed rate corporate bonds. In other words, FRNs play a role in diversification but mainly within the fixed income world, as they effectively provide a small exposure to the fortunes of the equity market, through what is known as “the credit spread”, or the additional return that an investor receives for lending money to an issuer.
Logically, higher risk credits need to pay higher credit spreads, and the opposite is also true, so that the Commonwealth has the lowest credit spread in the Australian fixed income market, excluding other sovereign issuers; it borrows below where banks deal between themselves. Now, all credit spreads tend to move in, and out, depending on what the market is expecting, in terms of the health of the economy. If the market senses that a recession is about to occur, then the market will require higher credit spreads from all issuers, to insure investors against the increased risk of default in a recessionary period; just as equity prices fall.
In the alternative, as equity markets rise, the ability of the issuer to repay is perceived by market participants to increase, all else being equal, and the credit spread contracts as participants require less and less insurance against possible default. This reduction in credit spread increases performance, as we saw in late 2009, in Figure 1 above. Now, when equity markets fall in price, investors require more and more insurance against the prospect of the issuer defaulting, all else being equal, so the credit spread increases and performance declines, as we saw in late 2008.
In other words, the FRN brings into the portfolio a small amount of equity related return, through the credit spread, although the volatility of the FRN is much lower than equity investments, since the investor is typically at a much more secure level compared to equity holders. To emphasise, FRNs are conservative investments, although they tend to move the same as equities, in terms of annual return, on average.
Yield curve – too steep, buy fixed rate bonds and wait for the correction
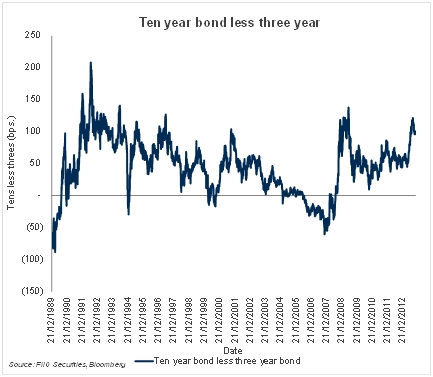
Despite the portfolio design issues, as considered above, and the macro-economic issues considered earlier, investors also need to consider the issue of yield curve steepness when investing in fixed rate issues, since the steepness of the yield curve tells you how much extra the investor receives for purchasing longer dated bonds. Specifically, yield curve steepness refers to the difference in yield between the ten year Commonwealth bond and the three year Commonwealth bond; the larger the difference, the more an investor receives in terms of return, from the ten year part of the curve, as opposed to the three year part of the curve. In other words, the steeper the yield curve, the more the investor gets paid for holding the longer part of the curve. Here, several observations can be made:
- First, the yield curve is currently steep, from a historical point of view, as shown below. Yield curves tend to steepen as markets anticipate rate rises, and the market has, in our view, already built an incorrect expectation into the yield curve. Second, the recent down-turn of several country economic surprise indices means that growth expectations are heading lower and that will support demand for fixed rate bonds and will undermine support for equity markets as the weaker than expected data continues to be released. These developments should, all else being equal, be negative for equity pricing and to a lesser extent FRNs, yet positive for fixed rate bonds. All this should see the yield curve flatten further over 2014, so that investors will receive less from longer bonds (in terms of return) as we transition into 2014.

Figure 3
Conclusion
As we have pointed out several times, most Australian investors have far too much allocated to shares. In this context, the need to diversify remains paramount. When looking at FRNs, we find that these securities really do not help diversify a portfolio with a lot of equity risk, as these securities tend to perform in a similar fashion to equities. If you have a bond portfolio, FRNs help diversify that portfolio and FRNs have a much lower overall return volatility when compared to equities, so they are a much more conservative investment than equities, in most cases. This analysis suggests that those who need to diversify their share portfolio need to allocate more to fixed rate bonds. Some suggestions include:
- Queensland Treasury Corporation 2033 at 5.30%
- Qantas 2020 at 6.00%
- Downer 2018 at 5.65%
- Stockland 2020 at 5.25%
- PMP 2018 at 8.64%
Note: Prices are accurate as at 29 October 2013 and subject to change.
Have a question or comment on this article? Email us here