Key points:
1. Profits on assets purchased at higher yields can be locked in before maturity.
2. Using those proceeds to switch into a second bond can enhance your original yield.
3. Active management of your portfolio is essential to maximise returns. We show how switching from an ING 2016 bond into a DBNGP 2019 can enhance returns.
I’m happy to report that we had quite a good response to last week’s article “Sell Financials” in which we highlighted how certain bonds in the financial sector would struggle to outperform further from current levels, with many clients switching into corporate bonds with better risk/reward trade-offs.
There is an aspect of this strategy that is not commonly appreciated, however, which is to do with understanding how the switch into a new asset improves the client’s return even when the original asset was acquired at an attractive yield.
To illustrate this, I will use a real-life and topical example: selling one of the securities highlighted in last week’s article (the ING Bank 7% 2016) to buy the Dampier Bunbury Natural Gas Pipeline (DBNGP) 6% 2019, which became available to retail clients this week. In this example, we will show how an original expected internal rate of return (IRR) of 6.09% improved to 6.93% through the benefit of this switch. Definitions of some of the key terms and formulae used here can be found at the end of this article.
The client bought $50,000 face value of the ING Bank 2016 on 1 June 2012 at a 6.00% yield. If the client held the ING Bank 2016 until maturity, they would achieve an IRR of 6.09% (which is the annualised equivalent of the 6.00% purchase yield) based on the cashflows in Table 1.

Table 1
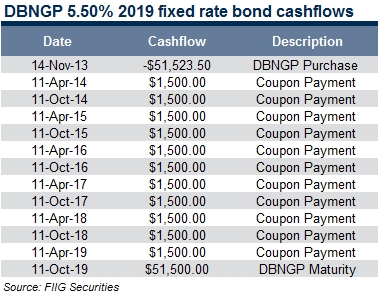
The client sold the ING Bank 2016 at a 4.15% yield and bought the DBNGP 2019 at a 5.50% yield for settlement on 14 November 2013. On its own, the DBNGP will have an IRR of 5.57% (being the annualised equivalent of the 5.50% purchase yield) based on the cashflows in Table 2.

Table 2
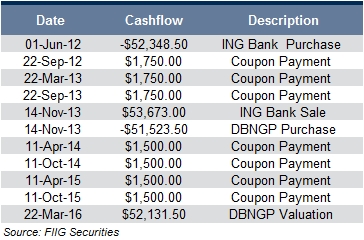
So how does this translate into an improvement on the base case of a 6.09% annualised return? We can quantify this by showing the cashflows up to the maturity date of the original investment, and then projecting the value of the new asset at that forward date. To calculate the projected value, we will use the original purchase yield (5.50%) even though it is likely to improve as the investment approaches maturity. As indicated by the cashflows in Table 3, the IRR from original purchase date of the ING Bank to its maturity date has improved from the original 6.09% to 6.93%. This is achieved as a result of locking in the profit on the ING Bank as it rallied from a 6.00% yield to a 4.15% yield.

Table 3
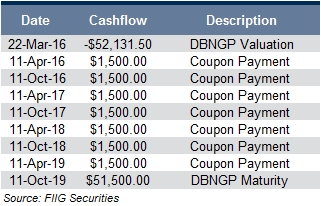
The DBNGP investment would then continue until its own maturity, receiving the expected 5.57% annualised return from March 2016 until October 2019, based on the cashflows in Table 4. Of course, if the yield on the DBNGP has fallen due to the fact that it is now a shorter-dated asset, it could then be possible to lock in those profits and repeat the process with another security.

Table 4
This is another example of how active management of your portfolio can enhance your returns over a simple hold-to-maturity strategy. In general, this IRR enhancement analysis can be applied to most cases where an investor is selling a security to buy a different security of equal or longer term to maturity at a higher yield. In case you missed it, we ran some very interesting analysis around the benefits of active portfolio management in a previous article, “Active portfolio management vs hold-to-maturity – the difference may surprise you”.
Key terms and formulae
Face value
Is the initial capital value of the bond and the amount repaid to the bondholder on its maturity.
Internal rate of return (IRR)
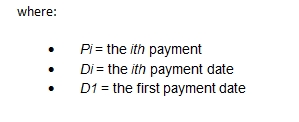
The discount rate that makes the net present value of all cash flows from a particular project equal to zero. The formula for calculating IRR is an iterative one, where a rate is sought that satisfies the following formula:


Yield
The income return on an investment. This can vary slightly from the IRR where it is quoted in semi-annual, quarterly, or monthly terms, whereas an IRR is quoted in annual terms.