by
Dr. Stephen Nash | Oct 08, 2013
Introduction
- This article uses US data since 1962 to stimulate returns for equities, nominal fixed rate bonds and inflation linked bonds and uses it to classify periods of low, moderate and high inflation. The article then assesses asset class performance under the three inflationary environments. Such analysis underscores the need for ILBs. More specifically, we explore the portfolio design with ILBs in the following three ways:Provide details of our long term ILB simulation.
- Consider the broad frequency of occurrence for US inflation since 1962, for various inflation ranges
- Consider how equities, nominal bonds, and ILBs perform, within each of the inflation ranges.
1 Simulation details
While we have limited data on ILB yields, we do have extensive daily data on nominal yields, and we can simulate the ILB performance using the assumptions that we used last week, so please refer to the assumptions quoted last week in the article “Obscured by clouds”.
Hence the nominal annual bond returns are annual returns on US 10 year government bonds and the ILB returns are the annual returns on US government ILBs. In other words, we exclude the return obtained from credit markets; where most investors participate. If these returns were taken into account, returns would be significantly higher; something like 2% higher on average.
2 .Inflation frequency
Looking at longer term data reveals that inflation can be high for a significant period of time. While the US has now more credibility, in terms of keeping inflation controlled, than it did in the 1960s or 1970s, the US now has another important and challenging focus; unemployment. Given this focus, and the fact that Middle-East tensions are still high, the ability of the US to control inflation may well be hindered, especially in the context of the current political stalemate. While a breakout of inflation is not a central scenario for FIIG, the possibility of higher inflation is something that should be accounted for, within portfolio construction. As we indicated last week, portfolio construction should be aimed at underlying portfolio risk, not short term market movements. As Figure 1 indicates, inflation in the US has been above 4% for 37% of the time between 1962 and 2013.

Figure 1
Investors in defined contribution funds, where the investor takes the risk for the investment return, generally expect that investment portfolios will deliver returns above inflation; much like investors in defined benefit funds, where the fund provider takes on all the asset allocation risk. Accordingly, we investigate how the various asset classes perform, in each of the three inflation scenarios in section 3 below.
3. Asset class performance in different inflation ranges
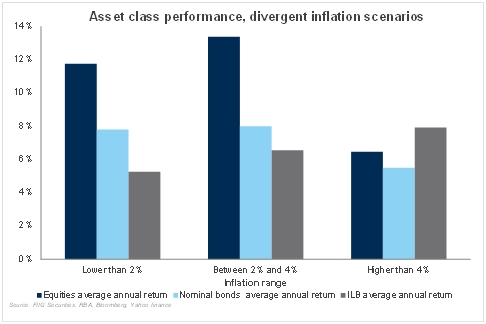
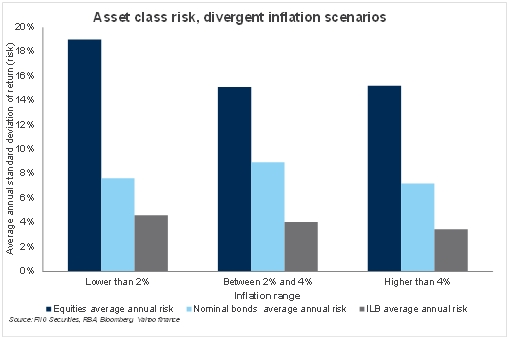
Now, we look at the average annual return statistics, for each inflation range. Return is only one aspect of the story, while risk is the other, and for equities, the results are not surprising; high risk prevails in all inflation scenarios. Moreover, equity risk spikes when inflation is low, as financial market participants begin to weigh the possibility of deflation and the possible impact on financial market stability. Such a situation is largely where we are at present, so the volatility that we are experiencing is very much consistent with this low inflation range, where the possibility of deflation lurks around almost every corner. That is not to say that high inflation is impossible in the medium term, rather it indicates that the current level of inflation is leading to an elevation of equity volatility; volatility that remains largely unrewarded, in terms of additional return.
In contrast to equities, bond volatility, both in terms of nominal and ILBs is fairly constant, and typically is lower than the average return from the asset class. In other words, bonds provide more return, on average, than the average variation in annual return. Volatility estimates for the ILB asset class may be a little conservative, given the assumptions of our simulations, as mentioned last week.
More specifically, one can see how the various asset classes perform, as follows:
- When inflation is low, equities do well in terms of average annual return, yet with an extremely high level of risk at around 19%, while nominal bonds come in second, yet with an annual risk of around 7.50%, and ILBs come in last, yet with a very small annual risk of around 4.50%. Equity risk increases in low inflation scenarios as market participants become concerned about the possibility of deflation and asset price declines, especially in the property market and the banking system, as has been witnessed in Japan for many years.
- When inflation is moderate, between 2% and 4%, equities do well in terms of average annual return, yet with a more moderate annual risk of around 15%, while nominal bonds come in second, yet with a higher annual risk of around 9%, and ILBs come in last, yet with a very small annual risk of 4.0%. Moderation of equity risk reflects the exclusion of deflationary scenarios, while bond risk, both nominal and ILB, remains largely constant.
- When inflation is high, above 4%, ILBs perform best, with low risk of around 4%, equities come second in terms of average annual return, with a high risk level of around 15%, while nominal bonds come in last, with a risk level of around 7%. In other words, when other asset classes, like equities and nominal bonds, struggle, ILBs can be relied upon to deliver strong returns, thereby protecting the portfolio against inflation.

Figure 2
Now, notice how equity volatility, as measured by the average standard deviation of return, spikes when inflation is low, while bond volatility, both nominal and ILB volatility, is largely constant, as shown in Figure 3 below.

Figure 3
Conclusion
Inflation remains a significant risk for all investment portfolios. Investors in defined contribution funds typically expect what investors in defined benefit funds actually receive from the plan sponsor; inflation plus an extra amount of annual return. In contrast, investors outside defined benefit individually accept all the investment risk, yet rarely take the same precautions as those responsible for defined benefit funds. Since these funds must match known future liabilities with assets, they typically allocate a generous proportion of the portfolio to ILBs; in some cases somewhere in the vicinity of 50% plus. While we underestimate bond returns in the above study, as we only consider government bonds, we use longer data periods, so as to obtain the broad return and risk characteristics for each asset class. Specifically, these characteristics suggest that all investors, not just defined benefit investors, should retain a large allocation to inflation linked bonds, not just for their low risk attributes, but mainly because of their ability to directly insure against inflation; either high or low inflation.