by
Dr Stephen J Nash | Oct 16, 2012
Definition and discussion of “bubbles”
An economic bubble, or speculative bubble, is typically defined as the observation that an asset trades at a large variance from an “intrinsic” value that is difficult to accurately specify on a contemporaneous basis. In other words, large variations in expectations of “fundamental” values can occur, which forces prices up dramatically, only to subsequently deflate. One of the most famous “bubbles” was the south sea bubble, between 1711 and 1720, where the South Sea Company, founded by the English in 1711, was created. While the company was a public-private partnership that was supposed to consolidate, and hopefully reduce the cost of the national debt, several market participants set about inflating the value of the share price through rumours of the potential value of trade in the “New World”. Share prices went up 10 times, from 100 pounds to around 1000 pounds, only to fall to the ground. Similarly, various speculators, or “fools”, are seen falling back into the South sea, as shown in Illustration 1 below, which was created to symbolise the events of the bubble.
Illustration 1: (Source: Wikipedia. Scanned from reprint of 1841/1852 editions of "Extraordinary Popular Delusions and the Madness of Crowds" by Charles Mackay, LL. D. ISBN 1-5866-3558-1)
Hence, the emphasis of the enclosed article looking at expectations of growth and inflation, with a view to discerning if they are overly optimistic, or overly pessimistic.
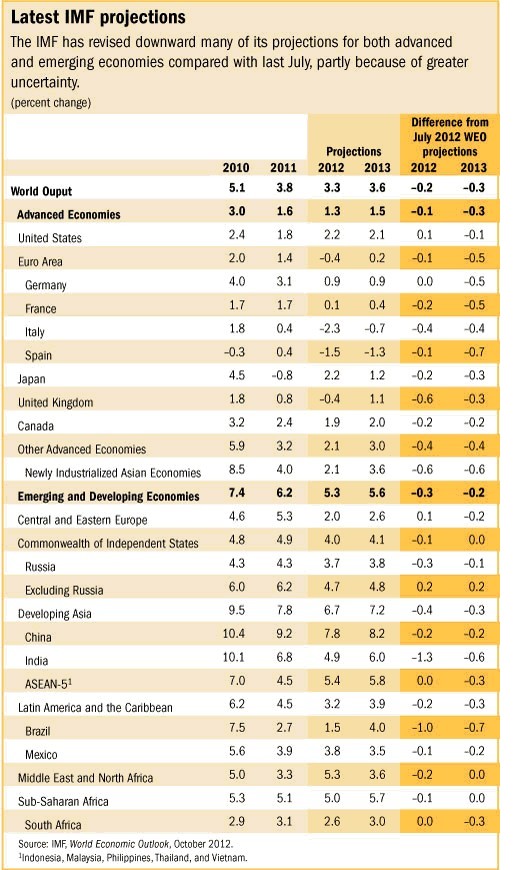
Table 1: (Source: IMF, http://www.imf.org/external/pubs/ft/survey/so/2012/RES100812A.htm)
Some sobering forecasts from the IMF
Recently, the International monetary Fund (IMF) published the World Economic Outlook, where it presents forecasts for the global economy, as shown in Table 1, to the left. Here the IMF revised global growth expectations down further. Some of the highlights are as follows:
Growth
- Growth forecasts in the US have been shaved down for 2013, to 1.5%, a fall in forecast of 0.1%, from the July forecasts.
- Growth in the Euro area has been reduced for 2013, to 0.2%, a substantial fall of 0.5%, from the July forecasts.
- Spanish growth forecasts have been reduced 0.7% for a 1.30% fall in growth in 2013, from the July forecasts.
- Chinese growth has been revised down for 2013 to 8.2%, a small fall of 0.2%, from the July forecasts.
CPI
Advanced economy CPI has remained unchanged at 1.6% for 2013, unchanged from the July forecasts, while emerging market inflation is up 0.2% to 5.80% in 2013.
IMF global risk assessment
Not only are the growth forecasts falling at a rate of knots, but the risks of these forecasts not being met have increased significantly, to the extent that the IMF indicate that the risk of a serious slowdown is now “alarmingly high” (IMF, World Economic Outlook, October 2012, p.13). Furthermore, as the IMF indicate,
More generally, downside risks have increased and are considerable. The IMF staff’s fan chart, which uses financial and commodity market data and analyst forecasts to gauge risks––suggests that there is now a 1 in 6 chance of global growth falling below 2 percent, which would be consistent with a recession in advanced economies and low growth in emerging market and developing economies (IMF, World Economic Outlook, October 2012, xvii).
Of particular concern is the growth path of Europe, as shown in Table 2, where the Euro area has been in “the red”, or contracting almost all of 2012, and Spain beginning to contract at an increasing rate. Specifically, the most recent observations indicate a deepening of declines in demand, which is now broadening from peripheral Europe to core Europe.
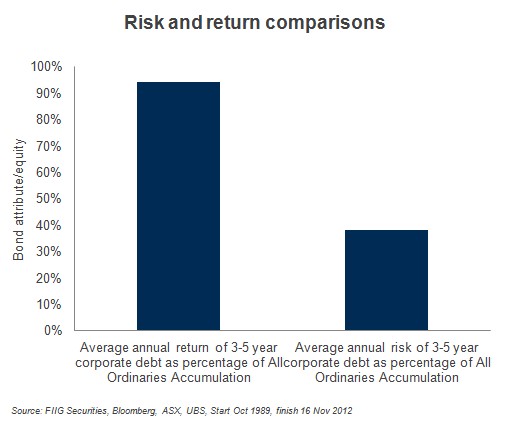
Table 2: (Source: IMF, World Economic Outlook, October 2012, p.3)
If we are concerned about the prospects for growth, it is evident that others are as well. Policy-makers, are torn between austerity policy, designed to restore balance sheet integrity and policies that support of demand. As Lawrence Summers, the Charles W. Eliot university professor at Harvard, and a former US Treasury Secretary, recently observed with regard to the recent IMF meeting in Tokyo, the need to support demand is probably the most important objective at this time,
This is a dangerous cycle whatever your economic beliefs. Doctors who prescribe antibiotics warn their patients that they must complete the full course even if they feel much better quickly. Otherwise they risk a recurrence of illness and worse yet the development of more antibiotic resistance. So too with economic policy. Advocates of orthodoxy prize consistency. Those like me whose economic thinking emphasises promoting demand worry that expansionary policies carried out for too short a time will prove insufficient to kick-start growth while at the same time discrediting their own efficacy and reducing confidence.
The Tokyo meetings [of the IMF] may not have had immediate impact. But the IMF’s emphasis on the need to sustain demand and its recognition of the importance of avoiding lurches to austerity can be very important for the medium term only if it is sustained through the next round of economic fluctuations [brackets added] (“The world is stuck in a vicious cycle”, Financial Times , 15 October).
Fed and continual disappointment
We agree with Lawrence Summers, and would argue that the Fed is correct, that growth will stay lower for longer. Yields will fall in line with that new reality and the long end will flatten, as overly optimistic expectations on growth are crushed. While the Fed is telling us that growth will approach trend at a slow rate, they have flagged that risks to this outlook are weighed to the downside, as the FOMC indicate
As in June, participants in September judged the uncertainty associated with the outlook for real activity and the unemployment rate to be unusually high compared with historical norms, with the risks weighted mainly toward slower economic growth and a higher unemployment rate (FOMC, Summary of Economic Projections, p.1, Minutes of the Federal Open Market Committee, September 12–13, 2012).
Even though downside risk is evident on growth forecasts, the low inflation forecasts are not subject to anywhere near the same assignment of uncertainty. In other words, the FOMC is hoping growth returns to trend, yet the reality is that these forecasts will prove to be overly optimistic.
These modest expectations of the FOMC need to be contrasted to those of the market, which have been too optimistic for too long. Also, the optimism on growth and inflation is nothing new, as it has been a feature of the market for many years. For example, in 2010, private forecasters thought growth for the year ended 2011 would be 3%, as shown by the blue line in Figure 1, and it turned out to be 1.75%. Now, forecasters are looking for growth to head back up to 3%, as shown by the red line in Figure 1, and we can expect that these forecasts will follow the same pattern as the forecasts made in 2010. In other words, a market that gets paid by making clients take on financial risk, especially equity risk, will be disappointed once again.
It is as if we are in a period of continual disappointment.
Janet Yellen, Vice Chair, Board of Governors of the Federal Reserve System pointed out this procedure of continual disappointment in June of this year. As Yellen indicates,
... recovery from the recession has turned out to be persistently slower than either the FOMC or private forecasters anticipated. Figure 6 [Figure 1 below] illustrates the magnitude of the disappointment by comparing Blue Chip forecasts for real GDP growth made two years ago with ones made earlier this year. As shown by the dashed blue line, private forecasters in early 2010 anticipated that real GDP would expand at an average annual rate of just over 3 percent from 2010 through 2014. However, actual growth in 2011 and early 2012 has turned out to be much weaker than expected, and, as indicated by the dotted red line, private forecasters now anticipate only a modest acceleration in real activity over the next few years (“Perspectives on Monetary Policy”, Remarks by Janet L. Yellen, Vice Chair, Board of Governors of the Federal Reserve System, at the Boston Economic Club Dinner, Federal Reserve Bank of Boston, Boston, Massachusetts, June 6, p. 9).
Revisions to professional forecasts of GDP growth
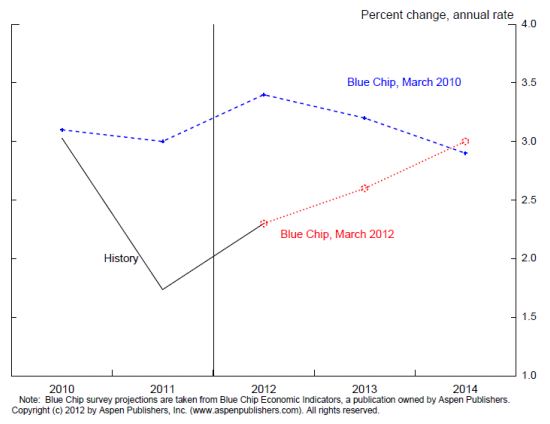
Blue line: Blue Chip Forecasts March 2010
Red line: Blue Chip Forecasts March 2012
Figure 1 (Source: “Perspectives on Monetary Policy”, Remarks by Janet L. Yellen,).
Bond market pricing, long end cheap
Despite the assurances from the FOMC, that inflation targeting has not been abandoned, the US bond market remains unwilling to buy longer term US Treasuries, as Figure 2 shows. On the right hand axis, we chart the interest rate spread of the 5 year US Treasury to the 2 year US Treasury, where the yield of the 2 year is deducted from the yield of the 5 year. Notice how this spread has been falling, and is stable of late, and is now around 39bps.
On the left hand axis, we do the same analysis, yet use the longer part of the curve, the 10 year yield less the 5 year. Notice that the spread has been increasing of late.
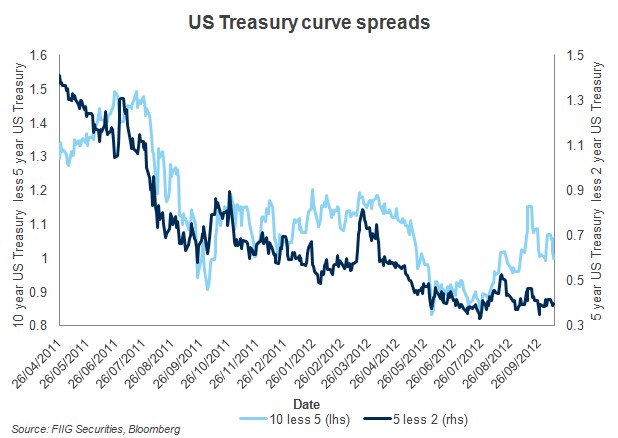
Figure 2
This analysis supports the proposition that the longer part of the US curve is relatively cheap, and the question now is whether the short end spread steepens, or the long end flattens.
With regard to the former, for the short end spread to steepen, the market would have to begin to anticipate a tightening by the Fed, which we would argue is a way too optimistic on growth. Alternatively, a steepening might be inspired by concerns about US creditworthiness. While such concerns remain a possibility, they are not part of a central set of expectations.
Lower long end rates are what the Fed wants, and fighting the Fed is not the best way to make money in a low growth environment. Hence, we would expect a flattening of the US long end to occur, meaning that US Treasury yields are not presently in a “bubble” or are over prices. In fact, the opposite situation exists; long US yields are cheap.
Domestic assessment, an easing bias
Against this sombre assessment of the IMF and the Fed, we need to assess the domestic situation, to determine if it is consistent with the global growth outlook. Given the change in the RBA assessment of the level of the Australian currency (AUD) and the impact of a weakening mining sector (in the minutes for the September meeting) we indicated that a change in RBA thinking had become evident. That change was evident in the recent easing of monetary policy on 2 October, and our assessment is summarised below,
As we observed with the recent RBA minutes, financial market commentators are quick to overstate changes in RBA rhetoric; they have a habit of “jumping at shadows”. What drove our assessment towards an easing, as published in the recent Bloomberg survey, was something quite simple; an unbiased reading of the recent minutes. A November easing now remains a possibility, yet developments in many variables will need careful monitoring before that would occur, as then the RBA typically moves more than once when it does move (“RBA rate decision - RBA board torn by the high AUD”, The Wire, 3 October 2012).
The RBA also indicated that, apart from concerns about the tightening AUD on the economy, and the declining demand for resources, the labour market was beginning to weaken. Regional slowdowns, as caused by an ongoing recession in Europe, are leading commodity prices lower, and thereby reducing demand and employment in the mining sector.
By cutting rates, the RBA hopes, among other things, to stimulate the sector that has been a recent drag on employment, namely the construction sector, with a weaker mining sector not providing the positive offset that it has over the last few months.
This weakness in the construction sector, particularly of new homes, has been one of the bigger surprises in the economic outcomes over recent times. Looking forward, a pick-up in construction activity is one of the factors that could provide an offset to the eventual moderation in the current very high level of investment in the resources sector (Source: “The Labour Market, Structural Change and Recent Economic Developments”, Philip Lowe, Deputy Governor, Speech to the Financial Services Institute of Australasia (FINSIA) Leadership Event, Hobart - 9 October 2012).
As Figure 3 indicates, mining has offset the fall in construction employment, in the year to August 2012.
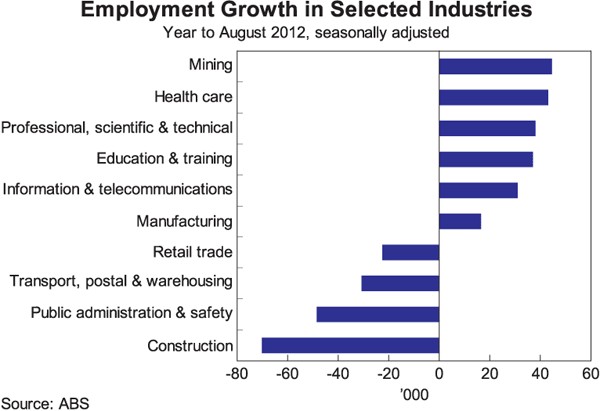
Figure 3, (Source: Graph 10, “The Labour Market, Structural Change and Recent Economic Developments”, Philip Lowe, Deputy Governor)
The problem is that discouraged workers, probably in the construction industry and elsewhere, are leaving the workforce, and this departure is reflected in the declining participation rate, as shown in Figure 4 below.
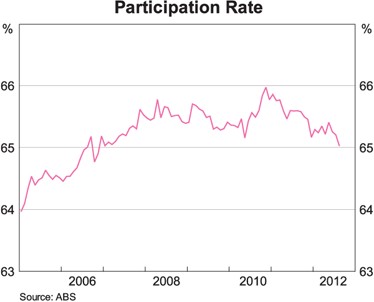
Figure 4, (Source: Graph 11, “The Labour Market, Structural Change and Recent Economic Developments”, Philip Lowe, Deputy Governor)
Rate cuts increase expectations of activity and therefore, tend to drive workers back into the labour market, which increases the participation rate, as we saw on 11 October. All else being equal, an elevation in the participation rate will drive a decline in the unemployment rate, as the number of job seekers increases relative to available jobs. As we said recently, this concern about a gradually elevated rate of unemployment has placed the RBA on an easing bias, and FIIG currently expects the RBA to ease 25bps in November, before waiting for a period of time, until easing further in late 2013, towards 2.50%.
On a more practical level, given this easing bias of the RBA, and the commitment of the Fed not to lift rates for some years, it appears unlikely that a repeat of the “bond crash” of 1994, where government bond yields rose dramatically in a very short time, will be repeated any time soon. Even if government rates were to rise somewhat, most FIIG clients would be cushioned, since credit spreads tend to compress in a rising rate environment. Also, the fixed income markets offers a great range of fixed income formats, so those concerned about fixed rates can select floating rate debt, or inflation linked debt. Finally, by buying direct fixed income, even if the worst happens investors can wait until the maturity of the bond, at which time the issuer is legally bound to pay you back in full. Only with investments that have no maturity, such equities, a property investment, or a managed fund, do you need to worry about finding a buyer in order to source liquidity.
Conclusion
Economic “bubbles” are not typically about the fundamental data, but about expectations. In this article, we review recent expectations of global economic growth, and we find that things are changing rapidly. While global institutions and the Fed are both very doubtful on growth, the typical Australian investor has ignored these developments as being part of a myth, or that the bond market is a “bubble”, just about to collapse. This article suggests the opposite, that there is no “bubble”, and that bonds are being priced partly in line with the sombre outlook of global institutions, including the RBA.
If anything, the bond market is being somewhat conservative in pricing bonds, with the Fed wanting rates lower, especially in the longer part of the US curve. Given the underlying concerns with the Australian labour market, and the depressing impact of the AUD on the Australian manufacturing sector, the RBA has now embarked on an easing bias. Typically, an easing bias is positive for bond prices, and typically supports even lower long bond rates. If the US long end is as cheap as we think it is, if global growth continues to stagnate, and if this global environment continues to support an RBA easing bias, rates are not headed high, as the “bond bubble myth” would have you believe. Rather, longer rates will be heading lower, possibly a lot lower. That is not to say there will not be volatility.