A Tier 1 ratio alone is insufficient to understand a bank’s comparative or stand-alone capital adequacy. This article explains why and uses various measures to determine relative capital strength between Australia’s “big 4” banks and 22 international banks.
Basel Tier 1 capital ratios can be an inaccurate indicator of a bank’s capital position and therefore can be misleading for investors. Capital ratios may vary according to:
- The domestic application of the Basel rules
- The way the banks themselves apply the rules and the risk weights
Domestic application of the Basel rules
There is no single implementation of the Basel recommendations. At the national level, each country exercises its own discretions and potentially adds additional rules when translating the recommendations into local regulation.
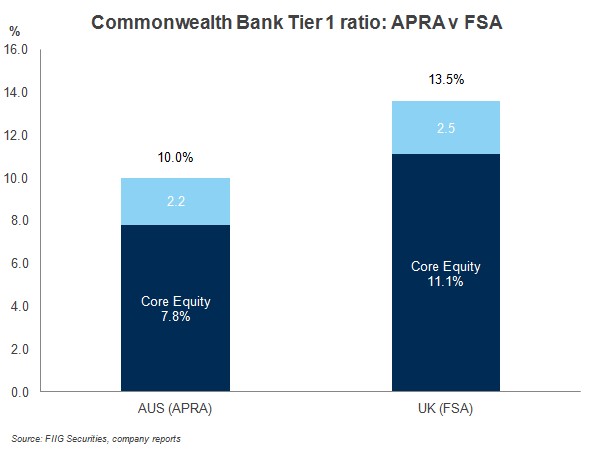
As an example the Commonwealth Bank of Australia's Tier 1 capital ratio at FY12 was 10.0% under the Australian Prudential Regulation Authority’s (APRA) rules while under regulation in the U.K. (the Financial Services Authority) it would be 13.5%. This reflects the more conservative application of regulatory rules in Australia, (more stringent definitions of capital and a more conservative computation of risk weights for some asset classes (such as residential mortgages)). The Tier 1 ratio also reflects the lower risk of Australian banks smaller trading operations and equity portfolios (which are higher risk activities than traditional deposit taking and lending). Australia is well known for its conservative implementation of Basel II and is the reason why domestic banks appear to have weaker capital measures than some international peers.

Bank application and assessment of risk weights
Even within the same jurisdiction, there can be differences in the regulatory risk weightings banks impose on various assets. This is driven by the variations in the methodology and models they use to assess this risk. For example, a study conducted by the U.K. FSA on 13 banks demonstrated they had very different estimates of probabilities of default for the same underlying risk. For example, the most conservative bank estimated a probability of default for “A” rated corporates they had lent to 10 times higher than the estimate of the most aggressive one.
A Tier 1 ratio alone therefore is not sufficient to understand a bank’s comparative or stand-alone capital adequacy.
Basel III
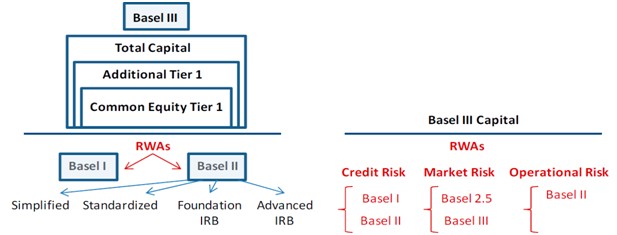
The above examples are based upon the current Basel II regulations. Under the new Basel III rules (which are being gradually phased in from 2013-23) one of the main aims is to raise the quality and consistency of these ratios, however differences will remain. While Basel III will foster greater convergence in the definition and composition of capital (the numerator), the denominator is the product of a mix of Basel approaches, as below.

Source: FIIG Securities, IMF
We can see that Risk Weighted Assets (RWA) can be can calculated under a number of versions of Basel, while there are also a variety of approaches to Basel II from simplified to advanced.
Moreover, Basel III has transition arrangements to increase capital requirements gradually and phase out ineligible capital instruments during a 10-year period starting in 2013 (including the grandfathering of certain hybrid debts until 2023).
While there will be some convergence, the implementation of Basel III is unlikely to remove all consistency issues in regulatory Tier 1 ratios. Some divergence is expected due to national discretion, the long transition period, as well as differences in banks' internal risk assessment models (which could continue to generate competitive distortions and therefore give impetus for banks to continue to use less conservative calculations).
Other measures of capitalisation
Apart from the Basel Tier 1 ratio, there are many other measures banks and their regulators use to measure leverage or capital adequacy. It is very difficult to establish a single measure which can reflect a bank’s true financial health. For starters, there is no precise definition of capital. While some exclude items which hold value (i.e. mortgage servicing right), others include items such as unrealised gains and losses (which fluctuate at the whim of the markets). However we can use these measures in conjunction with Basel ratios, and other information to get behind the numbers and to get a clearer picture of a bank’s true financial health.
Tangible Common Equity Ratio (TCE): TCE looks at how much common equity is supporting a company, and ignores intangible assets. The theory being that while intangibles can be valuable (i.e. good will, reputation, name recognition) in a liquidation they cannot be used for repayment of creditors (with some exceptions i.e. mortgage servicing rights). However TCE treats all assets as equally risky.
Standard and Poor's Risk-Adjusted Capital (RAC): S&P have developed their own ratio in 2009 during the crisis when the limitations of existing capital measures became evident to market participants. This measure attempts to neutralise the effects of regulatory regimes, national discretion, Basel options, and individual bank's risk assessments. This measure also tries to capture concentration risks (i.e. to geography, industry, product...), as opposed Basel which assumes infinite granularity/diversification of exposures.
Capital comparison
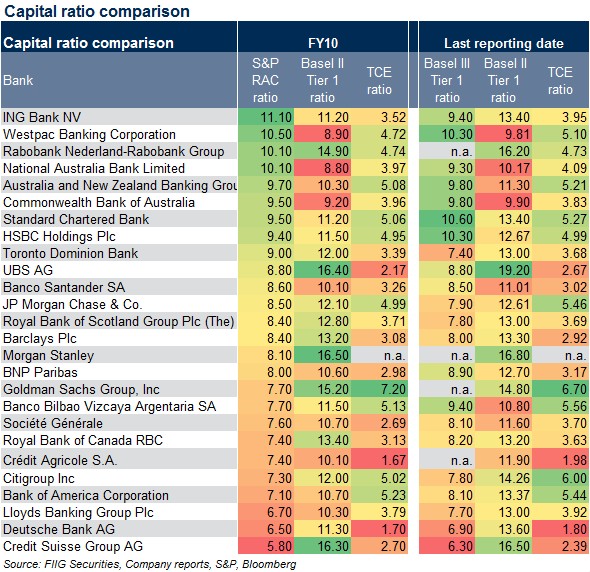
Table 1 below attempts to illustrate the strengths and weaknesses of different approaches and how these measures can differ notably. The colour coding ranks the banks with ratios from highest (green) to lowest (red) in this particular sample.

S&P’s RAC ratio is included above as a base given it is probably one of the best comparative indicators readily available. It was engineered to address the shortcomings of Basel II and attempts to strip out differences from country to country, enabling us to compare banks across regulatory regimes in a consistent manner. The last full period of data for the RAC is FY10 so that, the Basel II Tier 1 ratio and the TCE ratio are detailed in the first section at this date.
The “last reporting date” data is included to show more current information as there has been significant capital raisings and de-leveraging across most banks since FY10. This is intended to show the ratios as they currently stand, noting Basel III Tier 1 ratios are now included (in the absence of up to date RAC) to illustrate the differences between the Basel II and III regimes.
FY10 data
S&P argue that a RAC of 8%+ indicates that a bank should have sufficient capital to withstand a “substantial” stress scenario. Therefore more than half the banks on this list meet this benchmark at FY10, noting that this list is only of the biggest banks in each country, and not secondary institutions (i.e. this sample is only of (theoretically) some of the world’s strongest banks).
I note the sometimes substantial difference between the Basel ratios and the S&P RACs, in both absolute and relative terms. Most striking are the Australian banks which scored the lowest under Basel, while are among the strongest under S&P’s RAC. This reflects the more conservative application of regulatory rules in Australia as discussed above.
We also note the Swiss banks. For example Credit Suisse (CS) which is often touted as being very strong from a capital perspective given a Basel Tier 1 ratio of 16.3% FY10, the third highest in the above sample. However it is actually the weakest under S&P’s methodology.
The CS example is a perfect illustration of the possible dangers investors face when assessing banks on these “headline” ratios; while CS has a solid Tier 1 ratio, the quality of this capital is poor and the risk weighting of its assets is by no means conservative or arguably reflective of actual risks. CS capital base includes a high level of hybrid capital which amounts to 28.6% of eligible Tier 1 capital under Basel II at FY11 (the regulator maximum of hybrid capital is 35% of Tier 1). Under Basel III, no weighting will be given to these instruments. Under the proposed Basel III requirements, CS’s RWAs need to increase significantly given the group’s trading activities. This point is illustrated when we look at the most recent results, showing CS as the weakest of this group on a Basel III basis – noting the dramatic difference of a Basel II Tier 1 of 16.5% compared 6.3% under Basel III.
The Dutch banks (Rabobank and ING) also rank highly benefiting from businesses focussing on lower risk bancassurance businesses (traditional savings, lending and insurance) as opposed more volatile capital markets activity.
We also note the high ranking of HSBC and Standard Chartered whose business performed well during the crisis and proceeding years (given HSBS’s geographic and product diversification and Standard Chartered as an Asia focussed business with limited exposure to weaker economies).
Last reporting date data
This is intended to show the ratios as they currently stand, noting Basel III Tier 1 ratios are now included (in the absence of up to date RAC) to illustrate the differences between the Basel II and III regimes.
We note that in a relative sense Basel III appears well correlated to S&P’s RAC, and illustrates Basel III’s intention to raise the consistency and reduce bank and national discretions.
The vast majority of banks have improved their capital positions over the last few years, in response to market turmoil, and as they move to comply with higher regulatory requirements.
We note the significant absolute differences in some banks under Basel II and III. The Swiss banks, UBS and Credit Suisse recorded falls in Tier 1 of 54.1% and 61.8% respectively (as discussed above) while Deutsche Bank’s Tier 1 falls 49.2% under Basel III (reflecting its significant concentration to relatively volatile investment banking activities).
On a comparative basis, the Australian banks move to the top of the rankings under Basel III as the other banks’ ratios weaken (reflecting Basel III intention to allow for greater comparison across jurisdictions, and therefore better reflecting the strength of Aussie banks).
Basel III comparison
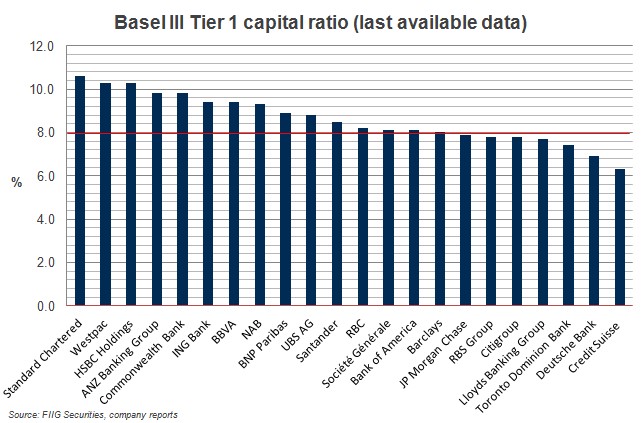
Let’s end by taking a comparative view of capital under the Basel III regime with the most up to date data available. The regulator’s minimum Basel III Tier 1 ratio is 6% (from 2015) excluding buffers. However given S&P state that Basel III will converge with their RAC ratio as it is phased in, we’ve used their 8% (i.e. should able to withstand a “substantial” stress scenario) as a benchmark in the chart below.
We can easily see the banks which do and do not meet this benchmark including those discussed above which are heavily impacted under the new rules.

Conclusion
Relying on headline capital ratios such as Tier 1 under Basel III, can be misleading. Such measures should be the starting point for further analysis, and not the ultimate indicator of financial health. These ratios can diverge significantly given the differences in regulators’ application of Basel and the differences in risk weighting methodology used by banks. It is therefore essential that investors have access to thorough research in order fully understand the risks.