by
Elizabeth Moran | Nov 07, 2012
Similar to other British banks, RBS demonstrated another quarter of underlying success, but reported earnings continue to be weakened by one-off legacy items.
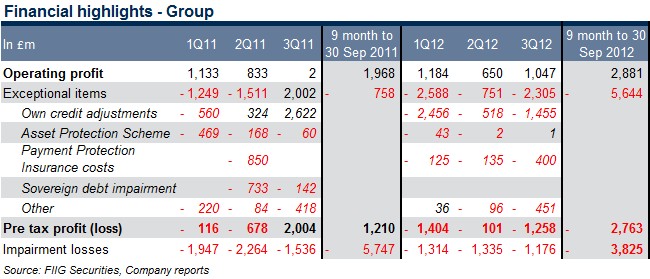
RBA reported a profit of £1.0bn for 3Q12, a 61% increase compared to £650m in 2Q12. For nine months to 30 September 2012 (9M12) the underlying profit increased 46% to £2.9bn, compared to £2.0bn for nine months to 30 September 2011 (9M11). On the other hand, the strong underlying results were masked by a set of one-off items, predominantly a £1.5bn fair value loss on own debt, as RBS’s credit spreads contracted (it is very common for the results to be hampered by fair value losses when markets are improving); and another £400m charge for mis-selling of payment protection insurance (see Table 1 for details).

Table 1
Key points to note:
- RBS reported a £1.3bn pre-tax loss for 3Q12, a substantial increase from a £101m loss in 2Q12. In 9M12, the Bank reported a £1.8bn loss, a major increase from £1.2bn profit for 9M11. The large variance is attributable to exceptional performance in 3Q11, when RBS took a major gain on own credit adjustments in the deteriorating market
- Retail & Commercial delivered a profit of £1.6bn in 3Q12, an 8% increase from £1.5bn in 2Q12, driven by somewhat stable performance in all divisions. Ulster Bank is still a drag, reporting a £242m loss, yet stable on a quarterly basis
- The Bank’s impairment losses were £1.2bn, a 12% reduction compared to £1.3bn in 2Q12. Overall, the impairments are steadily reducing; evidenced by a 33% decline in 9M12 to £3.8bn, compared to £5.7bn in 9M11 (see Table 1). Loan impairment charges represent 1.0% of customer loans and advances (excluding reverse repurchase agreements)
- RBS made excellent progress in strengthening its balance sheet: deleveraging, improving liquidity and capital ratios while reducing wholesale funding
- Further £7bn non-core asset run down achieved, with a total funded assets now at £65bn, a 75% reduction from £258bn at the end of 2008
- Core Bank’s loan to deposit ratio stands at 91%, making RBS fully funded by deposits. The Group’s ratio is 102%, in line with its UK peers
- Liquidity buffer, comprising of cash at central banks, eligible government and other debt, stood at £147bn
- Total wholesale funding was £159bn, of which £49bn or 31% was short term. The liquidity buffer is 3 times short term wholesale funding. In comparison to 2008, when short term funding was at £297bn or 67% of a total of £446bn funding, and the liquidity buffer was only £90bn, this highlights a more conservative strategy and a much stronger balance sheet from RBS
- Core Tier 1 ratio was 11.1%, or 10.4% excluding the effect of Asset Protection Scheme (APS) relief. A fully phased in Basel 3 ratio is of between 9.0% - 9.5% is expected by end 2013
Other developments:
- In mid-October RBS announced its exit from the UK government Asset Protection Scheme. RBS will have paid £2.5bn for its participation, without even making a claim. RBS also paid around £1.5bn for liquidity support received during crisis. In its announcement, RBS indicated that this early exit demonstrates progress the Bank made in transforming its balance sheet
- RBS completed an initial public offering of Direct Line Group, selling almost 520m shares generating gross proceeds of £911m. It is in line with its previous plan to divest control of Direct Line Group in stages by 2014, according to the European Commission (EC) state aid requirements
- Santander pulled out of its £1.65bn deal to purchase certain UK branch based businesses and while disappointing, RBS has recommenced its effort to divest the business and fulfil its obligations to the EC
- Following the ongoing Libor-fixing scandal investigation, RBS is expecting to start settlement negotiations in the near future and believes it will probably incur some financial penalties
RBS bonds

Prices and yields are accurate as at 6 November 2012, are a guide only and subject to market availability. FIIG does not make a market in these securities.