by
Dr. Stephen Nash | Aug 13, 2013
Typically, Australians contribute to their superannuation saving in a constant stream of payments which hopefully will grow over time. Sequencing risk looks at how this periodical stream of payments can be severely impacted by the timing of negative returns while the average return contributions remain the same. The final values of the investment can be significantly different, due to the timing of the negative and positive returns. While FIIG and others have highlighted the importance of sequencing risk, for pre and post-retirement, it is good to know that some eminent Australians fully support this approach, as we find with the recent work of Dr. Ken Henry, former head of the Australian Treasury and Chairperson of the “Australia’s Future Tax System Review”, otherwise known as the Henry Review into Taxation.
In this article we detail:
- A simple example of sequencing risk
- Various scenarios impacting volatility of the portfolio to show how dramatically the sequencing risk of the portfolio is impacted by return stream volatility
- Some of the commentary from Ken Henry on the subject of sequencing risk
1. Sequencing risk example
Sequencing risk refers to the order of returns and can be positive or negative. Final or terminal investment values can be severely impacted by “the luck of the draw”, meaning the timing of good return years and bad return years. By way of a brief example, if someone retired just before the GFC, and chose to invest in cash after using a 75% equities and 25% bond portfolio, then that investor would do considerably better in terms of terminal investment value than someone who did the same thing just six months later.
Sequencing risk is apparent throughout the accumulation, and de-cumulation phases of the investment cycle, and tends to increase in importance as the remaining investment horizon for the investor declines. While longer horizons allow the investor the luxury of regaining losses from a poor sequence, shorter horizons reduce this luxury. A simple example might help explain the risk.
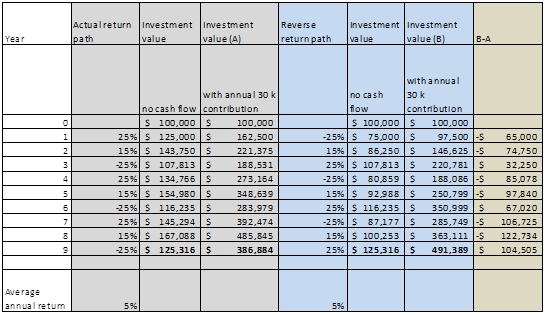
Assume that an investor has a $100,000 and invests that amount for nine years (See Table 1) with the grey box showing the actual sequence of annual returns. If we ignore the annual contributions of $30,000 per year, we can calculate the accumulated value of the portfolio over each of the nine, one year periods, coming to $125,316 at the termination of the ninth year. Now, if we include the annual contributions of $30,000 per year, the terminal value, at the end of the nine year period is $386,884. In contrast, the blue box shows what happens when the sequence of returns is reversed; same termination value when cashflows are excluded although large variations through the life of the investment period are evident, and exactly the same average return over the nine years. Note that reversing the order of returns is only one possible change in the sequence of actual returns and therefore only represents one possible change in sequence, among many.
Now, when we take account of the $30,000 cashflows, then the variations in terminal value increase dramatically. Specifically, we consider the additional cash is being invested with a very different return order, or return sequence.
For example, just look at year one in the grey box, where the first year had a 25% return at the start, meaning the investor receives 25% return on the $30,000 contributed in year one. This really boosts the value of the portfolio in year one, to around $162,500. However, since returns are -25% in the blue box, the value of the investment is much lower at the end of year one, at around $97,500. The difference, between these two sequences is given to the right, in the tan box, where we deduct the value in column A from the value in column B, so the difference is -$65,500.

Table 1
Note: Annual contributions of $30,000 for (A) and (B) are made at the start of the years, so are included in the return calculations
Now, look at what happens in year nine. Even though the blue box started out poorly, the sequence really starts to improve returns in the last five years, since there is only one loss year in the last five in the blue box, but two in the case of the grey box. Since the negative return periods are so large in size, they wipe out the grey box lead after year five. Variations in the investment value with cashflow, are described in the tan box, where we deduct the value of the reversed cash flow, or column B, from the original sequence, column A. Notice that the variations between the two sequences of return are very large.
2. Various scenarios of sequencing risk
Continuing with the example above, see the differential in value, between sequence A and B, in Table 1, in the tan box on the most right hand column, and note that the terminal differential, in year nine is very large, relative to the size of the terminal portfolio value in either case. Specifically, the terminal differential is roughly 27% of sequence A and roughly 21% of the sequence B terminal value.
In seeking why this differential is so large, we note that the annual volatility each year is very large, where the upside and downside variations are as high as 25%. Notice also that we use only two whole numbers in the sequence, either 15, or 25; be that positive or negative.
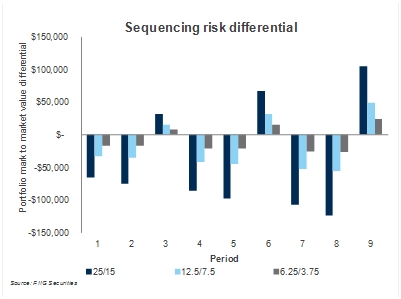
So, if we substitute the whole numbers of 25% and 15% with half that, with 12.5% and 7.5%, and then recalculate the sequencing risk differential, then we get the light blue columns shown in Figure 1. Further, if we halve these numbers again, then we obtain 6.25% and 3.75%, and the grey columns in Figure 1. So, in this case, the sequence of returns used to be as follows:
- Year 1 25% and is now 12.50%, and finally 6.25%
- Year 2 15% and is now 7.50%, and finally 3.75%
- Year 3 -25% and is now -12.50%, and finally -6.25%
- Year 4 25% and is now 12.50%, and finally 6.25%
- Year 5 15% and is now 7.5%, and finally 3.75%
- Year 6 -25% and is now -12.50%, and finally - 6.25%
- Year 7 25% and is now 12.50%, and finally 6.25%
- Year 8 15% and is now 7.50%, and finally 3.75%
- Year 9 -25%, and is now -12.50%, and finally -6.25%
Now, we show all three volatilities and what would happen to that tan box in Table 1 above, in terms of the size of sequencing risk, as we show in Figure 1 below.

Figure 1
Notice how sequencing risk declines, each time the volatility in the sequence falls. In fact, we roughly half the average absolute value of the yearly sequencing risk, for every halving of volatility. In other words, as underlying portfolio volatility falls, sequencing risk falls. This is how an allocation to bonds, with much lower volatility than shares has the capacity to reduce sequencing risk, particularly as investors’ age and their nest egg accumulates.
- Henry and sequencing risk
Official recognition of the importance of sequencing risk is not hard to find, and recently Ken Henry provided a detailed example of sequencing risk in a presentation to the Australian Securitisation Forum. Here, Henry establishes the assumptions of his analysis, as follows,
To keep things simple, suppose the superannuation fund member contributes the same amount for 20 years. Suppose the stock market crash occurs in year one. Then the average annual yield of the member’s superannuation portfolio over the full 20 years is 9.51 per cent. The reason it is so high is that only one-twentieth of the capital invested is affected by the stock market crash: 19-twentieths of the capital is contributed after the stock market crash has passed (“Why is portfolio allocation to domestic fixed income low in Australia and should it be increased?”, Address to the 11th Australian Securitisation Forum Conference, 23 October 2012, Hilton Hotel, Sydney).
Next, Henry introduces a change in the sequence of asset class performance, as follows,
Suppose, instead, that the stock market crash occurs in the 20th year. Then all 20 annual contributions are affected. The average annual yield in this case is a low 3.31 per cent
In typical understated style, Henry indicates that the sequence risk is “not-immaterial”,
In a 20-year superannuation accumulation, the difference between an average annual rate of return of 9.51 per cent and 3.31 per cent is not immaterial. Suppose the annual contribution is $25,000, implying a total contribution over 20 years of $500,000. The first case, in which the stock market crash occurs in year one, generates a final lump sum of $767,386 larger than if the crash occurs in year 20.
This means that sequencing risk is significant for the accumulation phase of superannuation, or when you are saving before retirement not just post retirement. Apart from other things, this means that if you think that “growth assets”, like equities, allow you to beat fixed income returns, then bear in mind the benefit of extra return comes at a cost, part of which should compensate for sequencing risk. While equities generally outperform fixed income, over a sufficiently long period of time, you can be unlucky, where,
In some years the share portfolio will lose more than half its value
Crucially, Henry argues that the problem of sequencing risk is not just something to be thought of only in terms of the de-cumulation or post-retirement phase of superannuation saving, but much earlier, through the phase where savings are being built up. Henry, like us, remains alarmed that Australia has the lowest OECD asset allocation to fixed income, and he thinks that the typical arguments for equity allocation, like longevity risk and the idea that sequencing risk does not matter is “absurd”.
Conclusion
In the first part of this note we introduced a simple example of sequencing risk, where we indicated how a typical superannuation fund can be impacted by the timing of negative returns. Then, we looked at how the volatility of the portfolio return really drives the size of the sequencing risk, where we progressively halved the volatility of the return stream, over nine years. Finally, we reviewed what Ken Henry has said about sequencing risk, and here, Dr. Henry was quite adamant that Australian superannuation asset allocation does not treat sequencing risk seriously. While the expectation that equity return always beats fixed income is part of the complacent Australian way of doing things, Henry urges more critical and careful assessment. We could not agree more, an increasing allocation to bonds as investors’ age and assets accumulate is extremely important. Next week we will show how bonds can help dampen portfolio volatility and therefore the sequencing risk that flows on from such volatility.