by
Dr. Stephen Nash | Apr 10, 2013
Introduction
Complacency is a dangerous thing, as it tends to dismantle the typical cautiousness that accompanies investment; it lures one into accepting risks that one should not accept. This article argues that equity investors are currently complacent, and the evidence is plainly apparent from an objective indicator, the VIX index. Yet, things are changing, as they always do. Specifically, two things are worthy of note.
First, the general run of economic data has begun to fall short of expectations, and if that continues, as it typically does, then expectations of growth should moderate, and complacency will become a thing of the past.
Second, the Bank of Japan has embarked on a much larger amount of quantitative easing than was expected, and this quantitative easing will hold down long yields in one of the largest global bond markets. Over time, the depression of Japanese yields should force down yields in other global government bond markets. This influence will be especially evident in the cheaper markets like the US and Australia.
VIX and bonds
The Chicago Board of Trade (CBOT) have an index that gauges the level of implied equity volatility, and it is known as the VIX, and it measures expectations of equity market volatility over the next 30 day period. Roughly, the index translates into the expected movement in the Standard and Poor’s 500 (S&P) index over the next 30 days, in an annualized format. Importantly, volatility is correlated to equity market moves, given the very different behaviour of markets when equity markets are moving up compared to when equity markets are moving down. In general, most rises are slow and small, while most falls are quick and large.
Hence, when the market expects declines in equities, the VIX rises, and rises dramatically, so the relationship between equities and the VIX is negative. Here, increases in the VIX are generally associated with declines in equity prices, as shown in Figure 1 below,
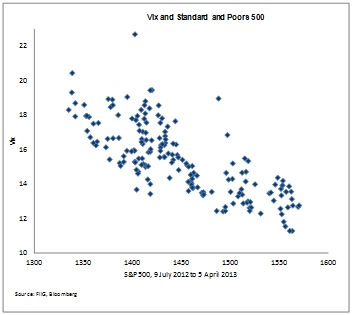
Figure 1
The opposite relationship is the case with government bonds, as shown below in Figure 2, where we estimate 30 year US bond prices from the current 30 US year bond, using a coupon roughly equivalent to the average yield that existed in the recent trading period. This relationship between the VIX and long bonds occurs because lower equity levels imply lower growth, and lower growth implies lower inflation and lower interest rates,

Figure 2
Hence, bonds can play a role in protecting portfolio value when equity markets fall, and they also do not suffer from time decay, as a normal option would over time. Longer bonds are more effective than shorter bonds in terms of this insurance role, as they hold more of the risk that typically boosts prices when equity market decline in value; interest rate risk.
VIX as an indicator of financial complacency
In addition to this relationship, the outright level of the VIX is an objective measure of the level of fear, or complacency, in the equity market. Low levels of the VIX generally indicate that market participants are not concerned about large falls in the equity market, and low VIX levels are typically associated with “bull” markets or where equity prices slowly but steadily rise. By way of contrast, high levels of the VIX suggest that the market expects the equity market to have a higher risk of falling. Recently, equity market participants have not been concerned about declines in the equity market, and this lack of concern, or financial market complacency, is currently reflected in the level of the VIX, which Figure 3 shows is low, in terms of historical comparisons (and back to pre-GFC levels),
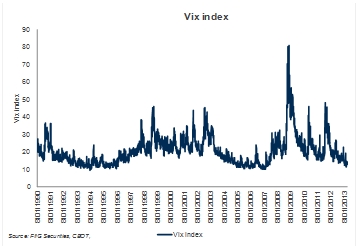
Figure 3
More recently, Figure 4 shows just how complacent the market has become, up to 5 April 2013,
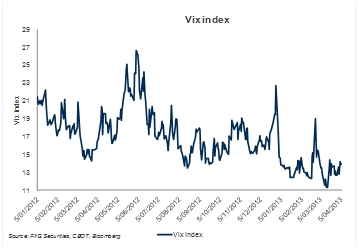
Figure 4
Complacency is a function of past “economic surprise”
In many ways, it can be argued that this complacency was largely conditioned by the pattern of economic releases, between June 2012 and late 2012. Here, economic releases were coming out at better than expected levels. However, all that has changed, as economic releases have recently been producing results that are worse than expected; both for Europe and the US. More specifically, the Citigroup economic surprise indices, as shown below, represent objective measures of economic news, relative to expectations of that news. Specifically, the economic surprise indices are the weighted historical standard deviations of data surprises; where actual releases are compared to the Bloomberg survey median of those releases. While a positive reading of the economic surprise index suggests that economic releases have on balance been beating consensus, a negative reading suggest the opposite.
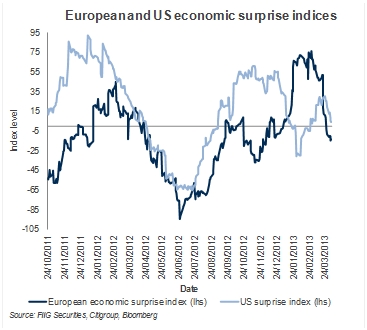
Figure 5
In many ways, the beauty of these economic surprise indices is not about the level of the index, although that is important, but the way the index shows the evolution of expectations over time. For example, the following is apparent:
- economic releases in Europe and the US bottomed about mid 2012, as expectations were lowered and lowered, to the point that expectations become overly pessimistic,
- economic releases then, after July 2012, came in better than expected, and the index improved, so that expectations gradually become somewhat optimistic, into around February 2013,
- after early 2013 economic releases failed to meet somewhat buoyant expectations, and expectations then began to subside, so as to meet the new reality of weaker than expected economic data.
Notice also how the economic surprise index is very auto correlated. Autocorrelation measures the degree to which one observation is impacted by the prior, among other things. In terms of investments, high autocorrelation is generally consistent with a trending market, as participants base future predictions on the prior experience; gains create more gains and the opposite is also the case. Looking at the rolling 20 day autocorrelation of the European economic surprise index, we see that it is over 80% for 63% of the time, from 19 July 2007 to 5 April 2012, and 66% of the time for the US economic surprise index. This means, apart from other things, that periods of correction in expectations are usually long and that once the index moves up, or down, it continues in the same direction most of the time. Hence, a change in market perceptions of growth is likely to become more apparent over time; one where complacency will be replaced by a heightened level of concern.
BOJ, an enduring source of long bond support
While the recent decline in expectations of growth are beginning to show up in government bond pricing, as yields begin their descent, a dramatic new development also supports lower long bond yields. Specifically, recent Bank of Japan (BOJ) action has created a large amount of buying pressure for long bonds, since the BOJ announced a much larger than expected quantitative easing, where the objective is to move longer interests rates lower, so that growth can be better supported. As the BOJ indicated in a recent statement,
“With a view to encouraging a further decline in interest rates across the yield curve, the Bank will purchase JGBs so that their amount outstanding will increase at an annual pace of about 50 trillion yen [or roughly AUD 500 billion]. In addition, JGBs with all maturities including 40-year bonds will be made eligible for purchase, and the average remaining maturity of the Bank's JGB purchases will be extended from slightly less than three years at present to about seven years” [brackets added] (BOJ press release, April 4 2013).
This announcement, and the anticipation of this announcement, has led to a dramatic flattening of the Japanese bond (JGB) curve, as shown in the yield spread graph below
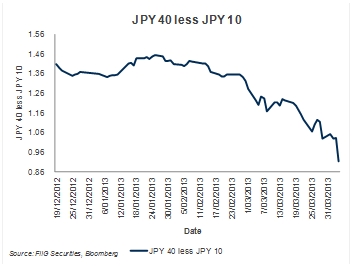
Figure 6
Importantly, this source of buying support for long bonds is currently supported by the fact that the market, especially the US bond market is still correcting to the complacency that had existed in equity markets as specified above. Among other things, this means that US bonds remains quite inexpensive relative to JGBs and other global markets, as shown in the yield spread graph below,
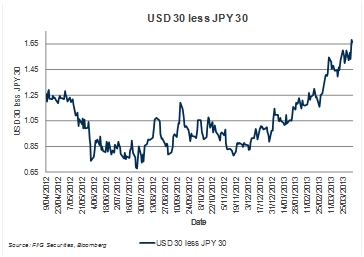
Figure 7
If US treasuries are relatively cheap, relative to a market that is being forced down in yield, then one would expect that the value in the US market will be competed away over time. Also, the bonds that trade above US treasuries in yield, like Australian 10 years, will benefit from the depression of yields in Japan; still one of the largest bond markets in the world, as shown in the yield spread graph below,
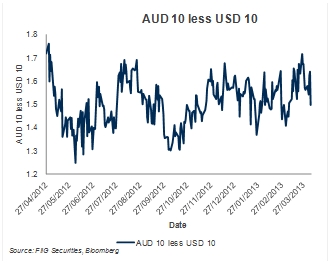
Figure 8
Conclusion
As we indicated last week, inflation needs to be taken seriously in the construction of portfolios. Yet, on top of this important consideration, this note warns investors to be fearful of complacency, and the current assumption of minimal financial risk at a time when economic releases are falling short of expectations. As we explain, this complacency has emerged in the last twelve months (with a return to pre-GFC VIX levels) from an improvement in economic data; an improvement that has already ended.
If you think that there is plenty of time to buy longer bonds, then we would argue that you need to think again.
Specifically, recent action by the BOJ should be borne in mind, as the BOJ represents a very large purchaser of bonds in a very large global government bond market, so that the BOJ’s actions will begin to depress global long dated yields. Further, the flattening of the JGB curve should also tend to flatten other global government curves, meaning long interest rates should be headed lower.
By all means, continue to hold high weighting s of equities in the portfolio if you feel “lucky”, and we have no objection to equity investment itself, but rather to excessive reliance on such investment. Importantly, you will need consistent luck to beat inflation by 4%, or more, as we noted last week.
In contrast to last week, this piece focuses on how bonds provide an effective means of protecting against declines in equities, especially longer bonds, as they typically rise in price when equities moderate in price. Not only do bonds perform this function, they perform it without the time decay normally associated with the purchase of other forms of protection, like equity put options.
Longer bonds, like the QTC 2033, and the longer ILBs, like the Sydney Air 2030, offer effective access to the downside protection provided by bonds. While these securities have recently been available at somewhat cheap levels, the actions of BOJ will work to eliminate that cheapness in the future.