by
Elizabeth Moran | Oct 08, 2013
One of the ways shareholders measure the performance of the share market is by looking at the movement in the All Ordinaries Index. An increase in the number is positive, a decline an overall negative. The Australian iTraxx works in much the same way for the bond market, although the lower the reading the better.
It shows investors an average spread or margin for a five year credit default swap over and above the benchmark bank bill swap rate (BBSW). It’s essentially a “proxy” of the perception of risk in the market. An increasing number means the market perception of risk is rising and thus investors demand a higher return to compensate for that risk and decreasing spreads the opposite.
Importantly, it does not incorporate outright yields. That is, the movement in base interest rates such as the Government bond risk free rate, the RBA cash rate or BBSW. The Aussie iTraxx only looks at the credit spread component that is overlayed or added to the base interest rates or yield curve. The iTraxx is an important tool in assessing the movement and trends in credit spreads for the broader market.
There are iTraxx indices for many countries and the Australian iTraxx is one of the smaller ones comprising the 25 most liquid and highly traded investment grade Australian entities in the market. Each of the 25 entities are given equal weighting. The Index “rolls” every six months where the list of companies changes to reflect the market. The most recent roll on 16 September 2013 saw the inclusion of Crown and Telecom New Zealand replacing Tabcorp and Singtel Optus. Some of the other companies included in the Index are: the four major banks and Macquarie, Amcor, BHP Billiton, CSR, Fosters, Lend Lease, QBE, Rio Tinto and Woodside.
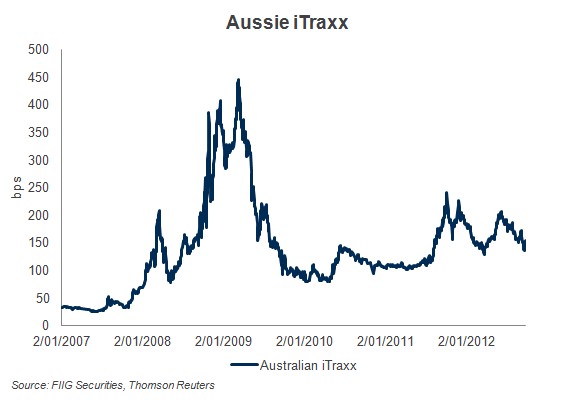
The chart shows the Australian iTraxx since 2007.
Key points to note:
- Pre-GFC the Index was consistently around 30 basis points (30bps = 0.30 per cent). This indicates that the average five year credit spread (or cost of borrowing above the benchmark rate such as BBSW) for investment grade issuers in Australia was around 30bps. A margin that was too low and did not compensate for the risk involved.
- In the midst of the GFC when the risk of a banking system collapse was very real and equity markets hit their nadir, the Aussie iTraxx reached a peak of 443bps. This margin was clearly too high.
- After March 2009 spreads rapidly improved in line with equity markets and settled below 100bps for much of late 2009 and early 2010. However, Greek sovereign debt issues became more widely accepted around May 2010 and the resultant concern around European sovereign (and bank) debt saw equities sell off and an increase in global credit spreads, mainly financials.
- Volatility returned mid 2011and spreads increased dramatically with the broader Eurozone sovereign and bank crisis.
- Quantitative easing and Mario Draghi’s “whatever it takes” comments reassured investors and spreads contracted from mid 2012.
- The iTraxx began 2013 at 116bps, dipped below 100bps early May then hit 148bps in June and has more recently settled around 120bps.
Interestingly, the iTraxx remains roughly four times its pre-GFC level of 30bps. Implying bond investors have reassessed the cost of risk and need to be paid more. In contrast the All Ordinaries Index at around 5,200 points is roughly at the same level as it was pre-GFC.
