by
Justin McCarthy | Oct 21, 2014
What is the Aussie iTraxx?
We are often asked “what is the Aussie iTraxx and why should I care about it”?
The simple answer is the Aussie iTraxx is a “proxy” for credit spreads in the Australian market. It is an index, not unlike the ASX All Ordinaries Index for equities, which provides information on the direction and trend of the market.
The Aussie iTraxx is composed of five year credit default swaps (CDS) for the 25 most liquid and highly traded investment grade Australian entities in the market. Each of the 25 “entities” is given equal weighting and must meet the following requirements to be included:
- The entity has to be listed on the Australian Stock Exchange (ASX) and have a five year CDS
- All entities must be investment grade by any of the three major rating agencies (S&P, Moody’s and Fitch) that rate them
- Market makers submit a list of the most liquid traded entities for the previous 12 months to the International Index Company (IIC). IIC then computes final liquidity ranking for each entity. The entities making the iTraxx are the top 25 as per the IIC final list. The list is refreshed every six months
- All constituents have equal weighting of no more than 4%
- No more than 5 banks can be included in the Index, thus comprising no more than 20% of the total weighting
The “price” of the iTraxx is simply the weighted average basis point (bps) cost of the 25 CDS contracts with each individual CDS acting as a “proxy” for credit spread on that particular company. Typically speaking, CDS and the actual credit margin on cash bonds from the same company will move in a similar fashion. The weighted average of all 25 CDS contracts then acts as a “proxy” for the credit spread of the Australian investment grade credit (or corporate bond) market as a whole.
Importantly, it does not incorporate outright yields. That is, the movement in base interest rates such as the Government bond risk free rate, the RBA cash rate or the bank bill swap rate (BBSW). The Aussie iTraxx only looks at the credit spread component that is overlayed or added to the base interest rates or yield curve (see below for further details).
Why should I care about it?
It is a source of information. It is similar to the ASX All Ordinaries Index for equity investors. It shows movements and trends and enables bond investors to benchmark changes in their own bonds versus the broader market. It can also be used, together with other indices and information sources (such as equity indices, volatility (VIX), interest rates and yield curves) to gauge market sentiment and likely future direction.
While not available to individual investors (unless you want to place a $10m minimum position), the Aussie iTraxx is used by professional investors and fund managers to speculate on the direction of credit spreads and to protect (or insure) against losses. Naturally, the effectiveness of the protection depends on how well the Aussie iTraxx replicates the characteristics of the investor’s physical credit exposure. Professional investors are attracted by the very liquid nature and transparency in pricing.
How has the Aussie iTraxx performed and how does it move with equities and interest rates?
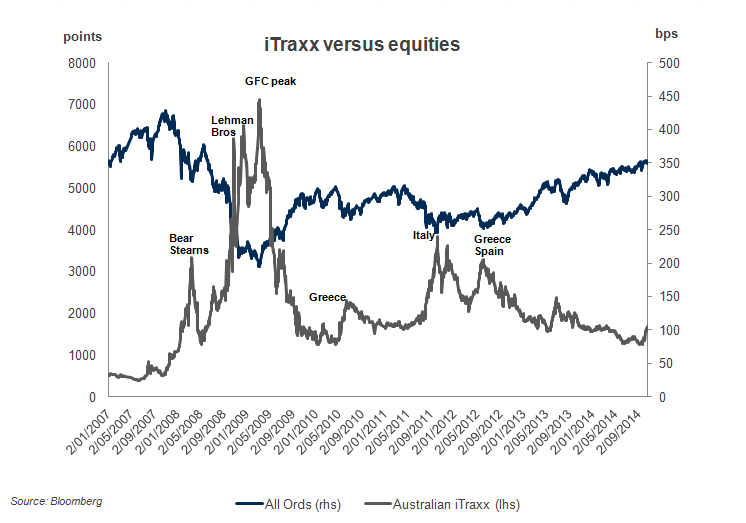
The following chart plots the Aussie Itraxx and the ASX All Ordinaries Index from January 2007 (i.e. pre-GFC) to date.

Figure 1
There are a number of important observations:
- Pre-GFC the index was consistently around 30bp. This indicates that the average five year credit spread (or cost of borrowing above the benchmark rate such as bank bill swap rate or BBSW) for investment grade issuers in Australia was around 30bp. A margin that most pundits would freely suggest was way too low.
- In the midst of the GFC when the risk of a banking system collapse was very real and equity markets hit their nadir (in March 2009), the Aussie iTraxx reached a peak of 443bps. This time a margin that was clearly too high.
- After March 2009 spreads rapidly improved in line with equity markets and settled around 100bp until Greece and the other PIIGS (Portugal, Italy, Ireland, Greece and Spain) raised concerns around European sovereign (and bank) debt levels. Equities again sold off and global credit spreads rose. The Aussie iTraxx followed suit and was characterised by the “risk on” and “risk off” periods that existed for some 18 months
- Finally, with the market becoming comfortable around European sovereign debt and US growth, equities again rallied and the Aussie iTraxx tightened to touch a low of 78bps on 18 September 2014. However, the selloff in Global and Australian equities that started in September 2014 has resulted in the Aussie iTraxx retracing to 105bps.
A clear trend that should have emerged from reading the above is the inverse correlation between credit spreads (as measured by the Aussie iTraxx) and global equities. When equities are falling, credit spreads are increasing and intuitively this makes sense.
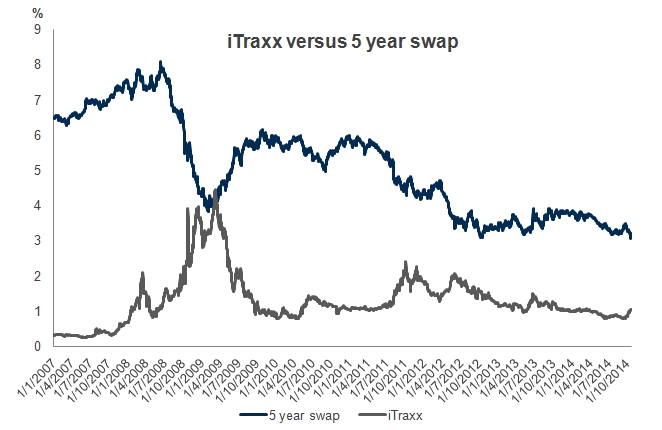
There is also a negative correlation between interest rates or more correctly yield curves and the Aussie iTraxx (representing credit spreads). When equities are falling and credit spreads are widening (typically in times of low growth and/or risk aversion), outright yields or interest rates are falling as the central bank lowers interest rates in an attempt to improve growth. This is not always the case but is a relatively useful rule of thumb.
The chart below plots the Aussie iTraxx and the Australian five year swap rate. Again the inverse relationship is clear to see.

Source: Bloomberg
Figure 2
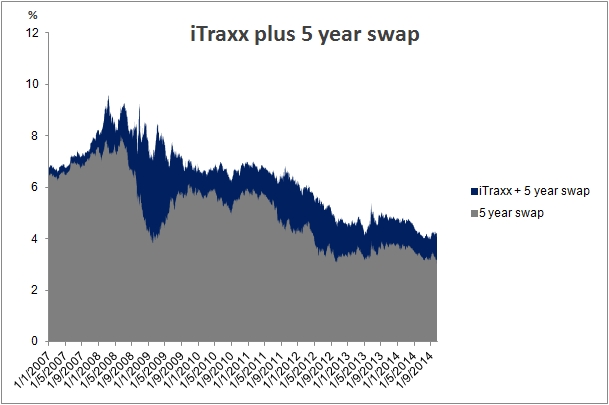
If we add the two together, as shown in figure 3 below, we get a proxy for the yield to maturity on five year investment grade corporate bonds in Australia. Note how the two tend to offset each other, particularly in times of significant volatility or movement.

Source: Bloomberg
Figure 3
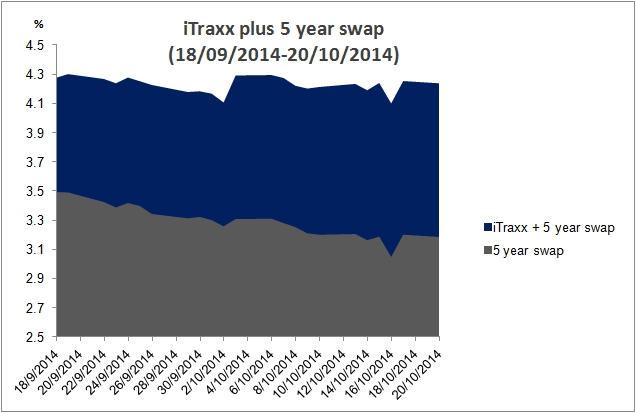
This inverse correlation and the smoothing effect is demonstrated in the final chart (figure 4 below) which highlights the relationship since 18 September 2014, where global growth concerns, Ebola and heightened geopolitical risks have seen equities fall, credit spreads rise 27bps (Aussie iTraxx out from 78bps to 105bps) and the five year swap rate fall 31bps (from 3.49% to 3.18%). Adding the two together, the total change in our proxy for yield to maturity has been a 4bps decline despite a significant movement wider in credit spreads, protecting the value of fixed rate bonds.

Source: Bloomberg
Note: y-axis commences at 2.5% to magnify the impact of the change in the 5 year swap and the credit spread (i.e. Aussie iTraxx)
Figure 4
It is important to remember that when fixed rate yields (i.e. the total of the benchmark rate plus credit spread) fall, the price of fixed rate bonds increases. This is a crucial concept to investing and a powerful strategy for protecting your portfolio against falling equity values and even credit exposures.
Many investors would have seen that the increase in credit spreads on their bonds over the month has been more than offset by the fall in base yields for fixed rate bonds such that the price has remained unchanged or even risen. However, floating rate notes (FRNs) have not seen the price improvement from falling yields but have felt the negative effect of rising credit spreads.
When the opposite is true and the economy is in a “boom” cycle, credit spreads are typically tightening. For fixed rate bonds the benefit of tighter credit spreads can be offset by rising yields (as cash rates are raised to combat inflation). FRNs in this scenario would generally receive the benefit of both tighter credit spreads and a rising benchmark rate (typically BBSW, which follows movements in the cash rate closely).
Copyright The contents of this document are copyright. Other than under the Copyright Act 1968 (Cth), no part of it may be reproduced or distributed to a third party without FIIG’s prior written permission other than to the recipient’s accountants, tax advisors and lawyers for the purpose of the recipient obtaining advice prior to making any investment decision. FIIG asserts all of its intellectual property rights in relation to this document and reserves its rights to prosecute for breaches of those rights.
Disclaimer Certain statements contained in the information may be statements of future expectations and other forward-looking statements. These statements involve subjective judgement and analysis and may be based on third party sources and are subject to significant known and unknown uncertainties, risks and contingencies outside the control of the company which may cause actual results to vary materially from those expressed or implied by these forward looking statements. Forward-looking statements contained in the information regarding past trends or activities should not be taken as a representation that such trends or activities will continue in the future. You should not place undue reliance on forward-looking statements, which speak only as of the date of this report. Opinions expressed are present opinions only and are subject to change without further notice.
No representation or warranty is given as to the accuracy or completeness of the information contained herein. There is no obligation to update, modify or amend the information or to otherwise notify the recipient if information, opinion, projection, forward-looking statement, forecast or estimate set forth herein, changes or subsequently becomes inaccurate.
FIIG shall not have any liability, contingent or otherwise, to any user of the information or to third parties, or any responsibility whatsoever, for the correctness, quality, accuracy, timeliness, pricing, reliability, performance or completeness of the information. In no event will FIIG be liable for any special, indirect, incidental or consequential damages which may be incurred or experienced on account of the user using information even if it has been advised of the possibility of such damages.
FIIG provides general financial product advice only. As a result, this document, and any information or advice, has been provided by FIIG without taking account of your objectives, financial situation and needs. Because of this, you should, before acting on any advice from FIIG, consider the appropriateness of the advice, having regard to your objectives, financial situation and needs. If this document, or any advice, relates to the acquisition, or possible acquisition, of a particular financial product, you should obtain a product disclosure statement relating to the product and consider the statement before making any decision about whether to acquire the product. Neither FIIG, nor any of its directors, authorised representatives, employees, or agents, makes any representation or warranty as to the reliability, accuracy, or completeness, of this document or any advice. Nor do they accept any liability or responsibility arising in any way (including negligence) for errors in, or omissions from, this document or advice. Any reference to credit ratings of companies, entities or financial products must only be relied upon by a ‘wholesale client’ as that term is defined in section 761G of the Corporations Act 2001 (Cth). FIIG strongly recommends that you seek independent accounting, financial, taxation, and legal advice, tailored to your specific objectives, financial situation or needs, prior to making any investment decision. FIIG does not make a market in the securities or products that may be referred to in this document. A copy of FIIG’s current Financial Services Guide is available at www.fiig.com.au/fsg.
An investment in notes or corporate bonds should not be compared to a bank deposit. Notes and corporate bonds have a greater risk of loss of some or all of an investor’s capital when compared to bank deposits. Past performance of any product described on any communication from FIIG is not a reliable indication of future performance. Forecasts contained in this document are predictive in character and based on assumptions such as a 2.5% p.a. assumed rate of inflation, foreign exchange rates or forward interest rate curves generally available at the time and no reliance should be placed on the accuracy of any forecast information. The actual results may differ substantially from the forecasts and are subject to change without further notice. FIIG is not licensed to provide foreign exchange hedging or deal in foreign exchange contracts services. The information in this document is strictly confidential. If you are not the intended recipient of the information contained in this document, you may not disclose or use the information in any way. No liability is accepted for any unauthorised use of the information contained in this document. FIIG is the owner of the copyright material in this document unless otherwise specified.
The FIIG research analyst certifies that any views expressed in this document accurately reflect their views about the companies and financial products referred to in this document and that their remuneration is not directly or indirectly related to the views of the research analyst. This document is not available for distribution outside Australia and New Zealand and may not be passed on to any third party without the prior written consent of FIIG. FIIG, its directors and employees and related parties may have an interest in the company and any securities issued by the company and earn fees or revenue in relation to dealing in those securities.